Hand-crafted by Flo, auto-checked by AI.
Resources
The 4 P’s of Marketing
Product
Anything that can be offered to a market for attention, acquisition, use, or consumption that might satisfy a want or need. This includes physical objects, services, persons, places, organizations and ideas.
- Core Product: The company’s products/services most directly related to their core business (phone: communication; entertainment)
- Actual Product: The tangible product that is being sold (phone: camera quality, display size)
- Augmented Product: Optional attributes added to the actual product, enhancing its value (phone: warranty, cloud storage)
Products can be offered solo, in bundles, or solutions:
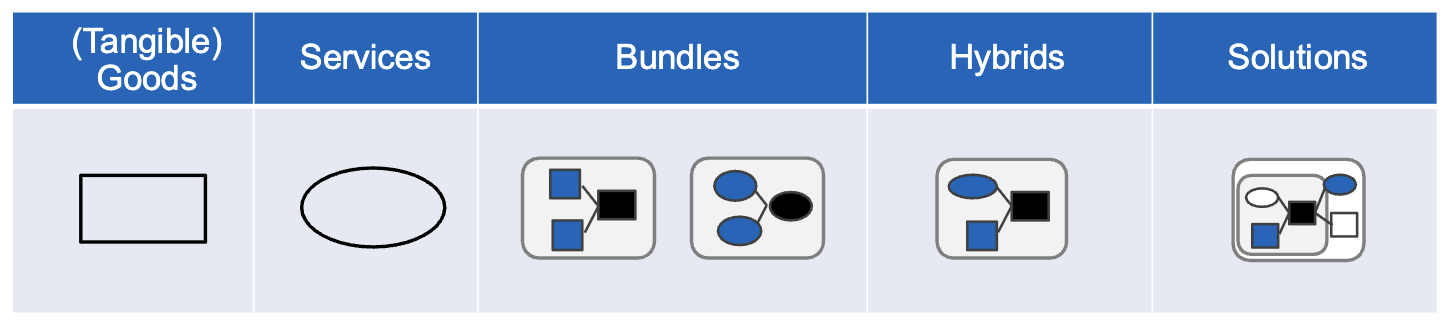
- Goods (Tangible): Used for personal consumption, or, for industrial goods, for business use
- Services (Intangible): An activity on offer that is intangle and does not result in ownership, see the IHIP characteristics below
- Bundles: Two or more products offered together, often at a discounted price
- Hybrids: A combination of usually integrated goods and services
- Solutions: A comprehensive offering that addresses a specific customer need using a combination of integrated products, typically at a higher price than the sum of the individual products
IHIP
The characteristics that distinguish services from goods:
- Intangibility: Services cannot be seen, touched, or stored.
- Heterogeneity: Services are often customized and can vary from one provider to another.
- Inseparability: Services are produced and consumed simultaneously.
- Perishability: Services cannot be stored for later use.
Branding
Brands exist in the minds of consumers. Companies position them using human traits; their brand personality. A brand is both tangible and intangible:
- Tangible: Logo, design, etc. Any feature that identifies the brand and differentiates it from competitors.
- Intangible: The feelings and associations that consumers have with the brand, which can influence their purchasing decisions.
Brand Personality
A set of human traits associated with a brand and pushed by the company to create a specific image in the minds of consumers. Strong brand personalities mean strong brand positioning (think about Fritz’ CDU sponsorship scandal).
Brand Sponsorhips
A company has multiple options to sponsor a brand:
- Manufacturer’s Brand: The company that produces the product also markets it under its own name (e.g., Apple, Nike).
- Private Brand: The product is produced by one company but sold under another company’s brand name (e.g., Balea by dm).
- Licensed Brand: The company pays to use the brand name of another company (e.g., Disney merchandise).
- Co-Branding: Two or more companies collaborate to create a product that features both brands (e.g., Nike and Apple collaborating on the Nike+ line).
Brand Development
When launching new products, companies have several options for extending an existing brand or creating a new one:
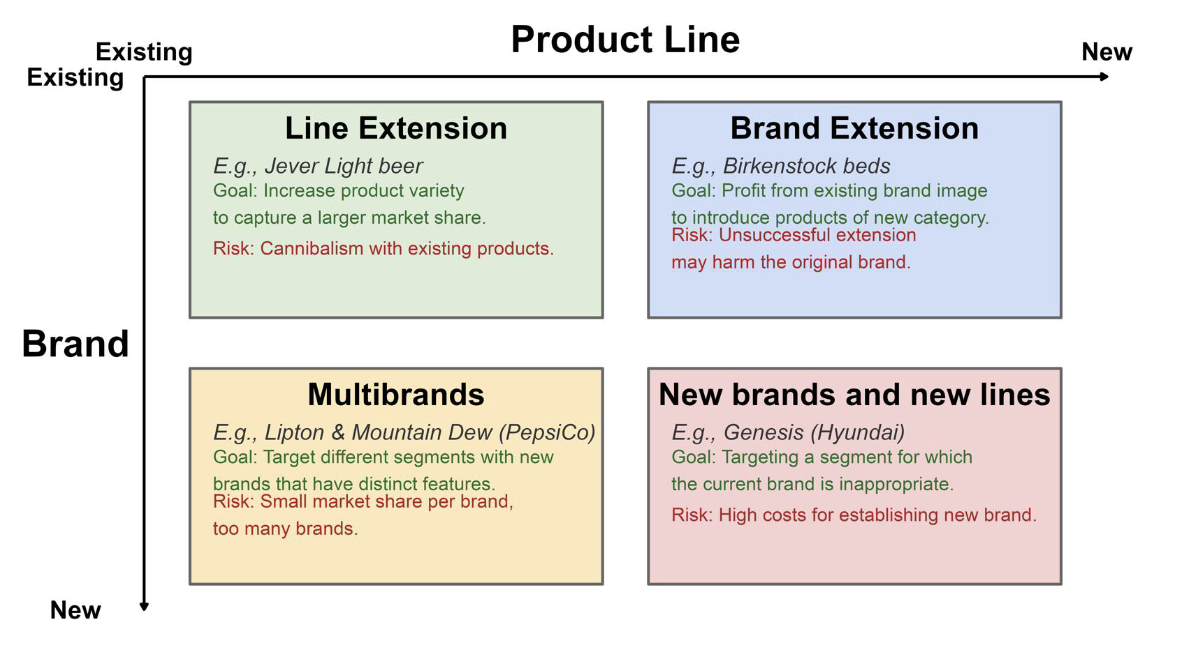
- Line Extension: Introducing a new product in the same category under the same brand name (e.g., Coca-Cola introducing Diet Coke). This aims at increasing product variety but risks product cannibalization.
- Brand Extension: Using an existing brand name to enter a different product category (e.g., Virgin Group extending from airlines to mobile phones). This can leverage existing brand equity but may dilute the brand if the new product fails.
- Multibrands: Introducing multiple brands in the same product category (e.g., Procter & Gamble’s multiple laundry detergent brands). This allows targeting different market segments but can lead to internal competition.
- New Brands: Creating a completely new brand for a new product category (e.g., Toyota creating Lexus for the luxury car market). This allows for a fresh start in a new market but requires significant investment in brand building.
Branding Strategy
How a company chooses to develop its brand is influenced its branding strategy (in order of
- Individual Brand: One staple brand for a product (e.g., Nutella). This allows for strong brand recognition and loyalty but can be risky if the brand faces negative publicity.
- Branded House: Multiple different products categories under the same brand (e.g. Google Workspace). This distributes one branding budget across many product categories, but a clear profile is more difficult to achieve, and bad performance of one product can affect the entire brand.
- House of Brands: Multiple brands under one company (e.g., Accor). This allows for targeting different market segments and reduces risk, but it can be costly to maintain multiple brands.
- Brand Transfer: Using the brand equity of an existing brand to launch a new brand in a different category (e.g., Porsche Design). This can leverage existing brand recognition but misfits can damage the original brand’s image.
- Co-Branding: Collaborating with another brand to create a product that features both brands (e.g., Milka Philadelpha). This can allow entering markets too far for a brand transfer, but it can also lead to brand erosion and negative spillover risks from the partner.
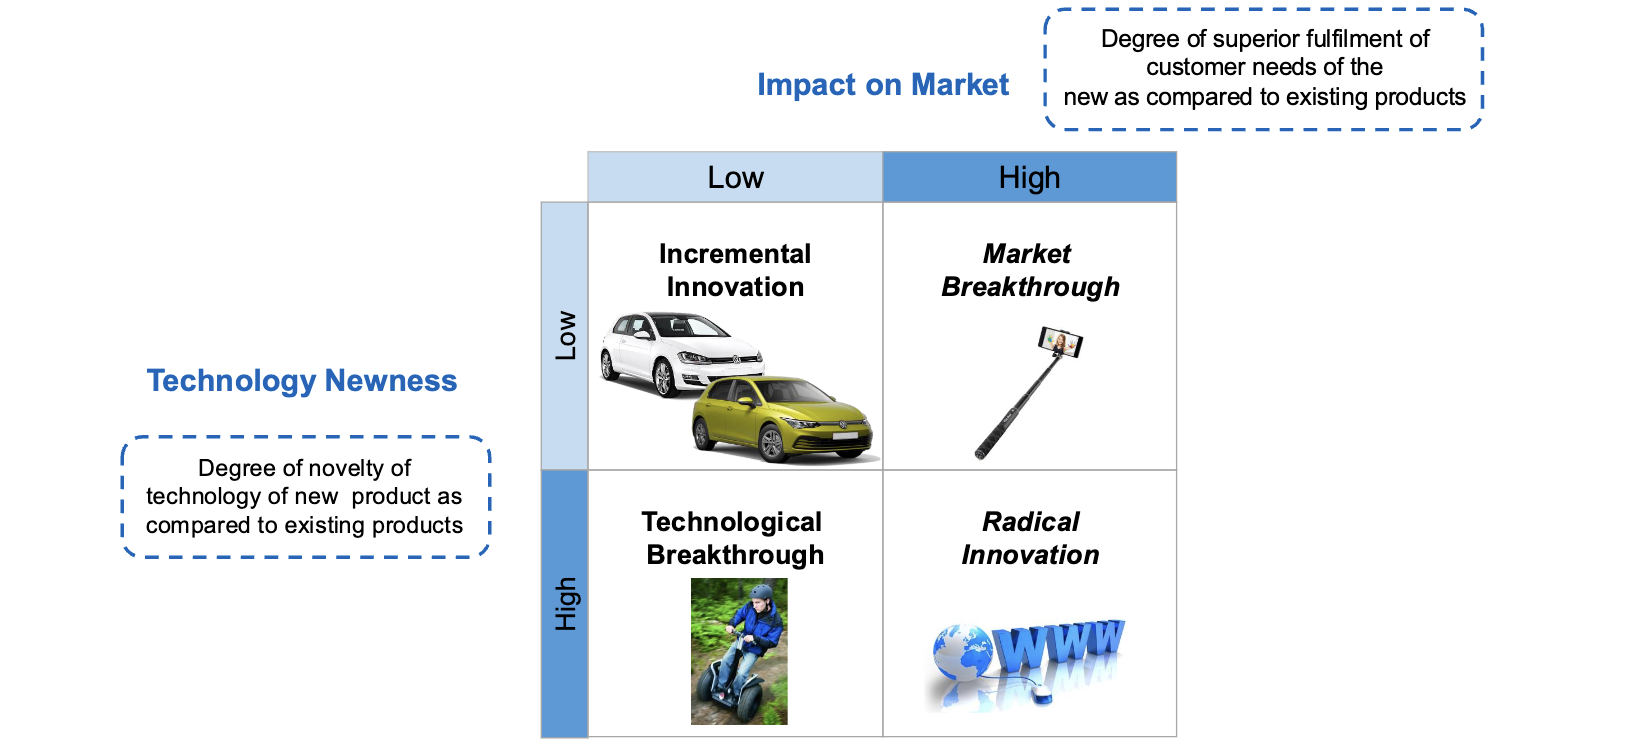
Product Innovation
Product innovation can come from inside or outside:
- External Environment: Advice/complaints by customers/distributors/suppliers, competitors’ activities, market research, etc. To avoid the “not invented here” syndrome, companies should use methods of customer integration, like the lead user method or open innovation.
- Organization: R&D, patent scanning (looking for patents that are about to expire), sales representatives, motivated employees, etc.
- Consultants: External product innovation consultants may bring in new perspectives and expertise (or not).
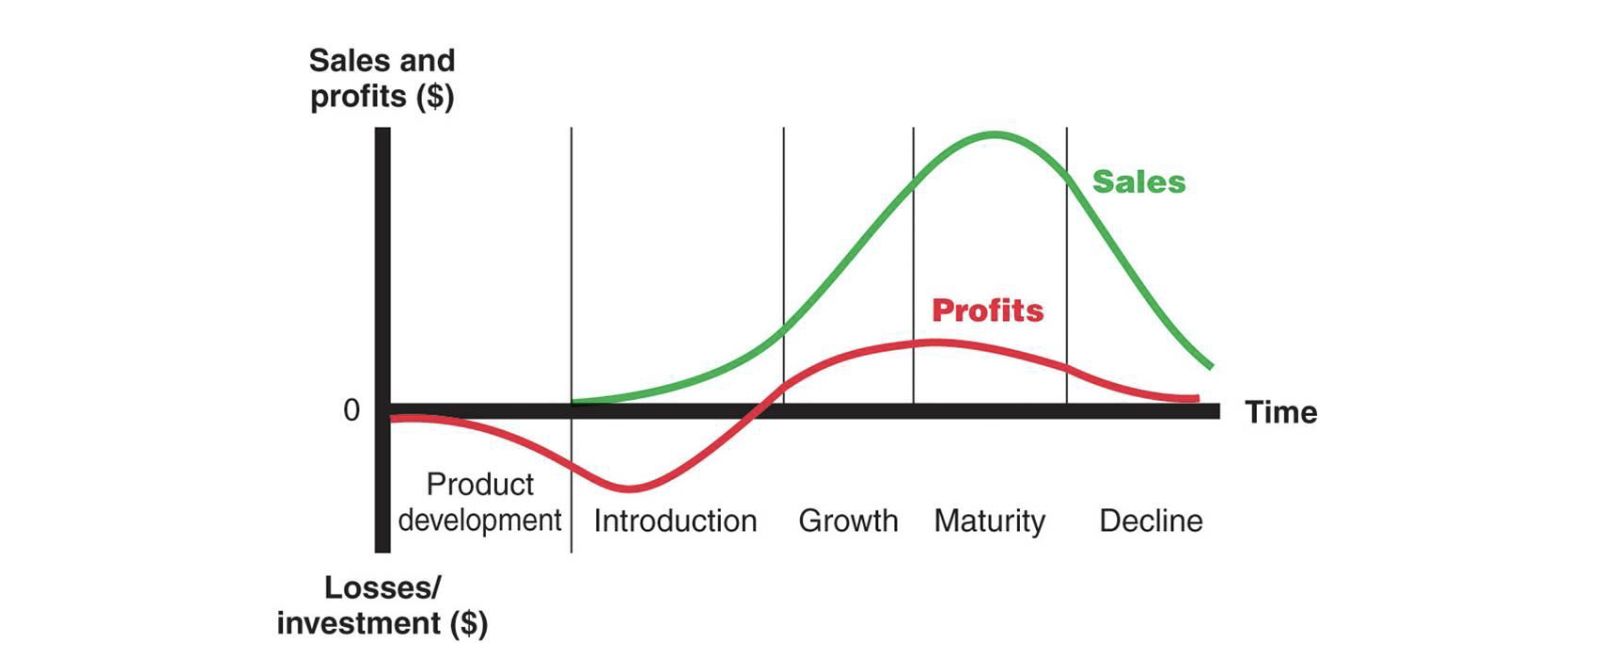
Marketing during the Product Lifecycle
- Development: Designing the initial GTM marketing strategy; target market and value propositions; test marketing.
- Introduction: High spending on promotion; marketing of basic product versions; aligning launch strategy with long-term position. In this stage, create awareness.
- Growth: Add distribution outlets; improve product and features; competitors enter the market. In this stage, build interest in mass market.
- Maturity: Decrease prices due to competition; identify new customer segments and update marketing mix. Most products are in this sage, so emphasize differentiation.
- Decline: Either maintain and reposition brand, harvest the product by reducing cost per customer (e.g. Bending Spoons), or drop the product. In this stage, reduce costs.
Behavioral Biases
- Overoptimism: Consumers overestimate how often they’ll use new features and therefore prefer and overpay for feature-heavy products.
- Attribute Framing: Consumers react differently to the same information depending on how it’s presented; e.g., 90% fat-free vs 10% fat.
- Endowment Effect: Consumers value a product more once they own it, which can lead to reluctance to part with it or higher willingness to pay for it.
Place (Distribution)
Where customers can find the product, how it gets to them, and through which channel it’s sold.
- Distribution Channels: How the product gets to the consumer; direct (website/store) or indirect (retailers, wholesalers, marketplaces).
- Locations (Physical/Digital): Where customers buy; physical (supermarkets, boutiques) or online (websites, apps).
- Logistics & Supply Chain: How products are stored and delivered; warehousing, inventory management; shipping speed.
- Market Coverage Strategy: How widely the product is available; intensive (everywhere), selective (select outlets), or exclusive (luxury, limited locations).
Intermediaries and Facilitators
Intermediaries (wholesalers, retailers) buy and resell products, while facilitators (transportation, warehousing) assist in the distribution process without taking ownership of the product or negotiating sales.
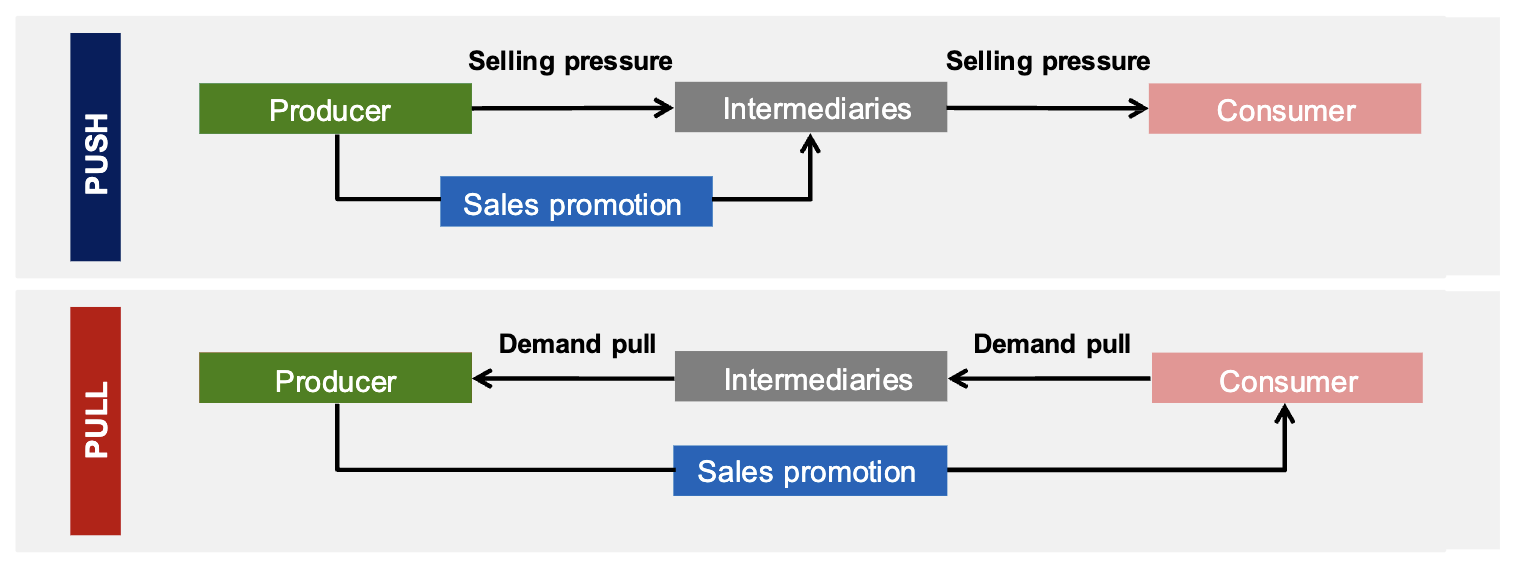
Distribution Systems
- Push Strategy: The company promotes the product to intermediaries (e.g., retailers) who then push it to consumers, complemented by outbound tactics to interrupt consumers and drive awareness. Best for new products, impulse buys, or short-term sales cycles. Tactics include trade shows, display ads, point-of-sale displays.
- Pull Strategy: The company promotes the product directly to consumers by providing value and building strong brand equity, creating demand that pulls the product through the distribution channel. Best for long-term customer loyalty, specialized products, high-consideration purchases. Tactics include (organic) content marketing, customer referrals, SEO.
Considerations
- Purchase Complexity: More complex buying decisions often require more direct or high-touch channels.
- Margin Structure: Low-margin products can’t afford expensive direct sales.
- Geographic Spread: Wide markets often demand intermediaries.
- Brand Control: Intensive distribution risks dilution; direct channels protect positioning.
- Customer Expectations: B2B buyers expect account managers; B2C consumer often expect instant online purchase.
- After-Sales Needs: Products requiring installation or support favor direct or certified reseller channels.
Therefore, different distribution strategies align with different objectives:
| Strategy | Description | Best For |
|---|---|---|
| Direct | Sell straight to end customer | High-margin, complex, or customized products |
| Indirect | Use intermediaries (wholesalers, retailers, agents) | Mass-market, wide geographic reach |
| Intensive | Maximum outlets | Commodities, impulse buys, convenience goods |
| Selective | Chosen retailers only | Mid-range brands wanting some control |
| Exclusive | Single or very few partners | Luxury, specialty, technical products |
| Omnichannel | Seamlessly integrated physical + digital | Modern retail, consumer electronics |
| Franchise | Licensed operators (in contrast to a chain) | Food service, hospitality, services |
Behavioral Biases
- Projection Bias: Consumers overestimate how much their future preferences will resemble their current ones, leading to over-purchasing or under-utilization of products (e.g. outdoor theater tickets on a sunny day).
- Social Pressure and Signaling: Consumers may make purchases to conform to social norms or signal status, which can lead to overconsumption or buying products that don’t fit their needs (e.g. luxury goods, latest tech).
Promotion (Communication)
How to inform customers about, increase interest for and perceived value of the product.
Promotion is a blend of communication tools used to inform, persuade, and remind customers about products. It includes five major elements:
- Advertising: Paid, non-personal presentation and promotion.
- Sales Promotion: Short-term incentives to encourage purchase.
- Personal Selling: Direct interaction between a sales representative and a customer.
- Public Relations: Building good relations with the company’s publics for a good corporate image.
- Direct Marketing: Direct communication with targeted individual consumers to obtain an immediate response.
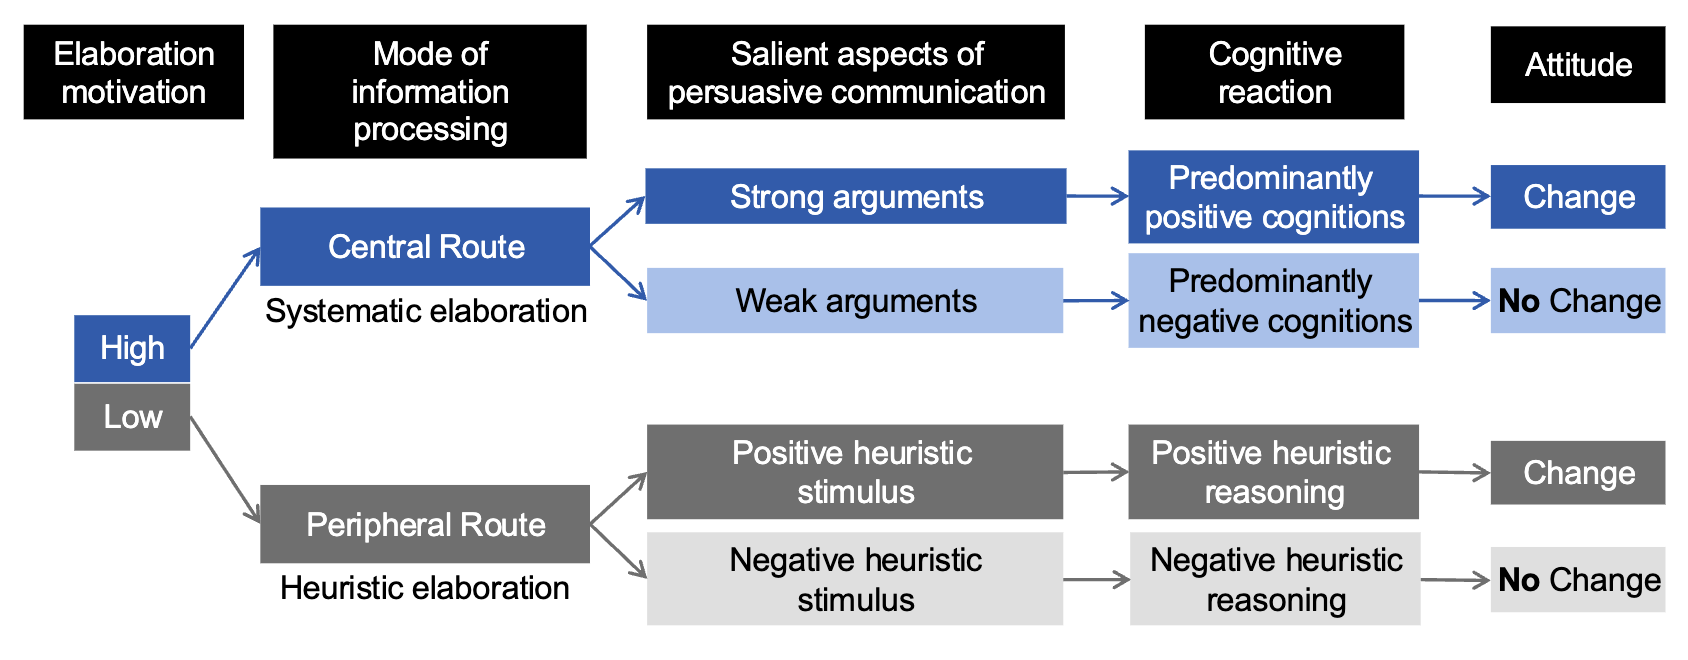
Elaboration Likelihood Model (ELM)
The ELM explains how consumers process persuasive messages through the central and peripheral route of persuasion, depending on the product involvement level:
- High Involvement: Consumers are motivated to process information deeply, leading to more enduring attitude change. Use strong, logical arguments and credible sources (central cues).
- Low Involvement: Consumers are less motivated, relying on properties like attractiveness, emotions, or social proof. Use catchy slogans, attractive visuals, and endorsements (peripheral cues).
Online Marketing
- SEM: Search Engine Marketing; paid search ads appearing in search engine results (Google Ads). Bidding on keywords; high-impact terms like “insurance” or “legal service” can cost 50-80€ per click in Germany.
- SEO: Search Engine Optimization; improving website visibility in organic search results through keyword optimization, content quality, and technical SEO (Google Index).
- DAO: Digital Asset Optimization; optimizing digital assets (e.g., images, videos) for better performance and engagement on digital platforms.
Social Media Marketing
Used by companies to communicate with target audiences, build brand awareness, and drive engagement. This can be firm-initiated (e.g., company posts) or consumer-initiated (e.g., user-generated content, reviews).
Social media allow for targeting large audiences, have a very low cost of entry, increase brand loyalty and provide customer insights. However, the firm has less control over the message and may face negative feedback. It’s time intensive and short-lived. Additionally, excess online marketing may offend consumers, and has been accused of taking unfair advantage of impulsive or less sophisticated consumers.
Behavioral Biases
- Overconfidence or Slippage: When consumers underestimate the amount of effort required to use delayed promotions (e.g. mail-in rebates) and fail to redeem them.
- Persuasion through Exaggeration: Exaggerated ad claims inflate brand evaluations even when consumers consciously rate them as less credible.
Price
The value consumers exchange for the benefit of having or using the product. It is the only element of the marketing mix that generates revenue, while all other elements represent costs. Price is driven by multiple facets.
- Internal Factors: Cost structure; Marketing goals and mix; Organizational structure
- External Factors: Market and demand; Competition; Economic factors
- Durable vs Nondurable Goods: Transaction costs (e.g. transportation); Opportunity cost of consuming; Maintenance for durable goods
From Free to Fee
Free offerings drive awareness and lower the barrier to first-time product trials. However, converting free users into paying customers remains a core challenge. Key decisions include in how much to restrict free features and how to price the upgrade.
Zero Price
Options with no monetary cost can lead to irrational consumer behavior, such as overvaluing free items and underestimating their true cost. This is because the emotional appeal of “free” can overshadow rational decision-making, leading consumers to make choices that may not align with their best interests.
Pricing Strategies
-
Cost-Based Pricing: Product-driven approach that tallies manufacturing costs and sets a price to cover these plus profit, then tries to convince customers of its value.
- This neither considers demand and consumer value, nor competitors’ activities. However, buyers often feel this is fair and it’s relatively easy to use.
- This neither considers demand and consumer value, nor competitors’ activities. However, buyers often feel this is fair and it’s relatively easy to use.
-
Value-Based Pricing (Target Costing): Consumer-driven approach, reverse to cost-based. Analyzes consumer needs and perceived value, sets a target price and allowable costs, then designs a suitable product.
- Essential inputs are the price-demand curve (maps demand at price points) and the price elasticity of demand (how sensitive customers are to price changes).
- Essential inputs are the price-demand curve (maps demand at price points) and the price elasticity of demand (how sensitive customers are to price changes).
-
Competition-Based Pricing: Market-driven approach, where prices and broader strategy are set by analyzing and reacting to competitors marketing and production choices.
- This may ignore customer value, neglect internal costs and the price-demand relationship, and risk price wars where all players end up worse off.
Pricing for New Products
Aside
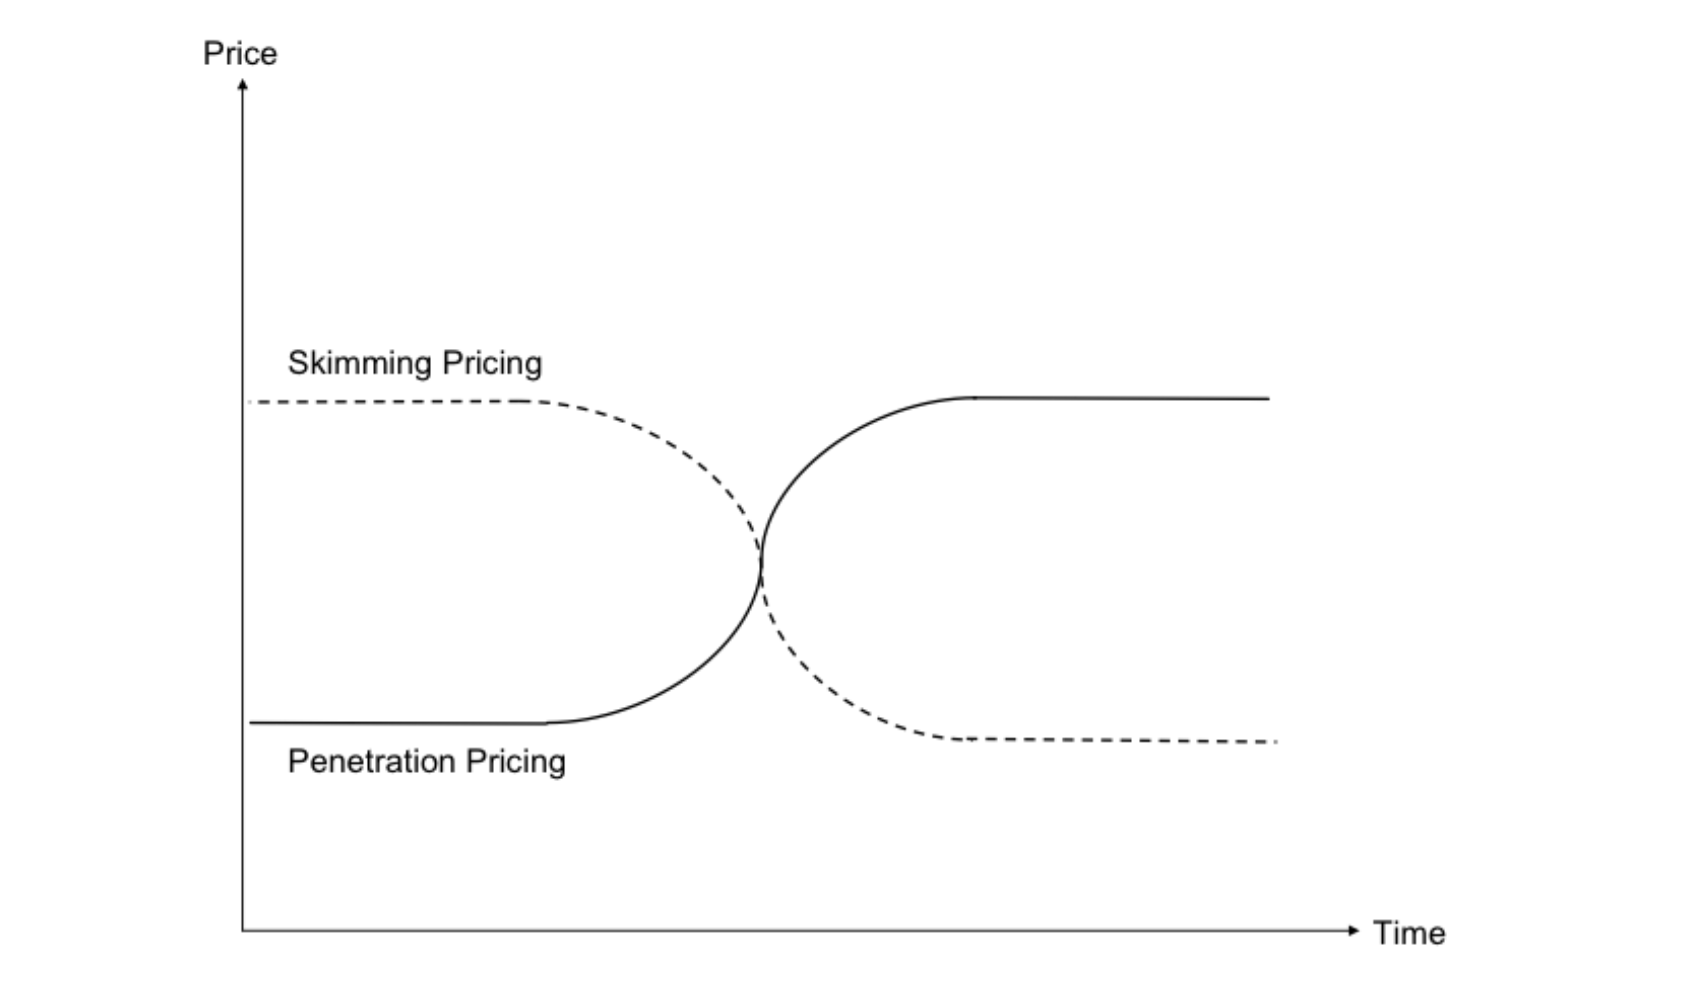
Two generic pricing strategies are common for new products: skimming and penetration pricing. In addition why are there suddenly two more??
Market Skimming
Charging a relatively high price for a short amount of time to achieve high short-term profits and effective market segmentation by using the newness or innovation of the product launched. This aligns with the quality leader strategy, as product quality and image must support the high price, and customers must be willing to pay.
Market Penetration
Charging a relatively low price to achieve rapid diffusion of the product and gain a high market share. This aligns with the cost leadership strategy and aims at quickly establishing a strong market position to profit from volume-based cost advantages.
Price Bundling
Offering several products as one combined product/service, where the consumer has to buy all or nothing (pure bundling) or can choose individual products instead of the bundle (mixed bundling). This is common in financial services, fast food, etc.
Price Discrimination
Setting different prices for different consumers.
- First degree: One price per customer, where the price equals each customer’s willingness to pay (e.g. auction or individual negotiation)
- Second degree: One price per customer segment, where the customer decides which segment they belong to (e.g. bulk discounts, standard/premium services)
- Third degree: One price per customer segment, but customers cannot decide which segment they belong to (e.g. student discounts)
Psychological Pricing
Although neoclassical economics would suggest the opposite, consumers (and business buyers) do not react rationally to prices, price differences, and price changes:
- Incomplete Information: Consumers cannot always a product’s quality, but use signals like price and reference prices to assess
- Prospect Theory: Humans tend to avoid losses instead of realizing equivalent gains, and base their decisions on perceived gains rather than perceived losses. Additionally, people dislike change and prefer the status quo.
Behavioral Effects
- Reference Price: Customers consider price relative to other products, which is why adding an irrelevant option can increase the attractiveness of a product (e.g. adding a more expensive option to make the original one look cheaper).
- Quality Signaling Effect: Higher prices can signal higher quality to consumers, leading them to perceive the product as more valuable and be willing to pay more.
- Endowment Effect: Consumers value a product more once they own it, which is relevant for money-back guarantees.
- Price Ending on 9: Can create the illusion of a better deal, as consumers often focus on the leftmost digits.
- Flat-Rate Biases: Consumers benefit psychologically from flat-rates (no concerns about cost, estimating usage, calculations, or risk of high prices) and therefore prefer them, even when they are more expensive than usage-based pricing.
- This effect is stronger for hedonic services (e.g. streaming) than for utilitarian services (e.g. electricity). Designing more hedonistic consumption experiences increase the likelihood of flat-rate opt-ins; at the risk of not delivering the promised hedonic experience.
7 P’s Model
The 4 P’s of marketing are often extended to better accommodate service providers, companies offering monetarily free services, those that capitalize on customer relationships, and non-profit orgs. The 7 P’s additionally include:
Addressing the IHIP Gaps
Services are generally defined by the IHIP characteristics, which create challenges for marketing. The 7 P’s model addresses these gaps as follows:
- Intangibility → Physical Evidence (tangible cues)
- Inseparability → People (employee appearance and conduct)
- Heterogeneity → People and Process (standardization)
- Perishability → Process (capacity and demand management)
People
Employees; Customers; Communicating Culture and Values; Employee Research.
For services, employees are part of the product (inseparability). Includes recruitment, training, motivation, etc. Acknowledges that variability in service quality is often due to people, making it a core managerial concern.
Physical Evidence
Facility Design; Equipment; Signage; Employee Dress; Other Tangibles.
The tangible cues in the service delivery environment are used to compensate for intangibility. Customers’ pre-purchase evaluation is based on tangible signals that can be used to reduce perceived risk and set expectations.
Process
Flow of Activities; Number of Steps; Level of Customer Involvement.
The procedures, mechanisms, and flow of activities by which a service is delivered (basically purchase UX). A well-designed process can enhance customer experience and operational efficiency, while a poorly designed one can lead to customer dissatisfaction and increased costs. Because customers often experience the production of a service, process design is a key element of the marketing mix for services.
Conjoint Analysis
A statistical technique to identify how much each part of a combination contributes to an overall preference, assuming that attributes are considered jointly. It’s further explained in Conjoint Analysis – Understanding Preferences. Opposed to multi-attribute attitude models (where participants rate each attribute individually) done to force participants to trade off between attributes, reduce halo effects (e.g. brand affinity influences all features), and to scalably simulate real-world purchase decisions.
- Attribute Importance is the relative importance of each attribute in the overall preference, calculated as the range of part-worth utilities for that attribute divided by the sum of ranges across all attributes.
- Preference for levels is the part-worth utility for each level of an attribute, indicating how much that level contributes to the overall preference compared to the reference level (which has a utility of zero).
Conjoint analysis is used to select product features, assess price sensitivity, as well as forecast volumes/market share/adoption.
- Define products by attributes and levels. These must influence respondent choices, must be under the firm’s control and realistic, mutually exclusive, and should span a feasible range.
- Design product profiles. Instead of a full factorial design, the common choice is a fractional factorial design, which reduces the number of profiles while maintaining orthogonality.
- Conduct the survey. Respondents rank, rate, or choose between profiles.
- Estimate part-worth utilities using regression analysis, where the dependent variable is the preference for each profile and the independent variables are the attribute levels