Parts of this page were generated by AI.
Resources
“Positioning is not what you do to a product. Positioning is what you do to the mind of the prospect.” (Al Ries & Jack Trout)
Segmentation, Targeting, and Positioning (STP)
The STP Model is a core strategic marketing framework used to prioritize value propositions, guide product development, and deliver relevant, personalized communication to distinct customer groups.
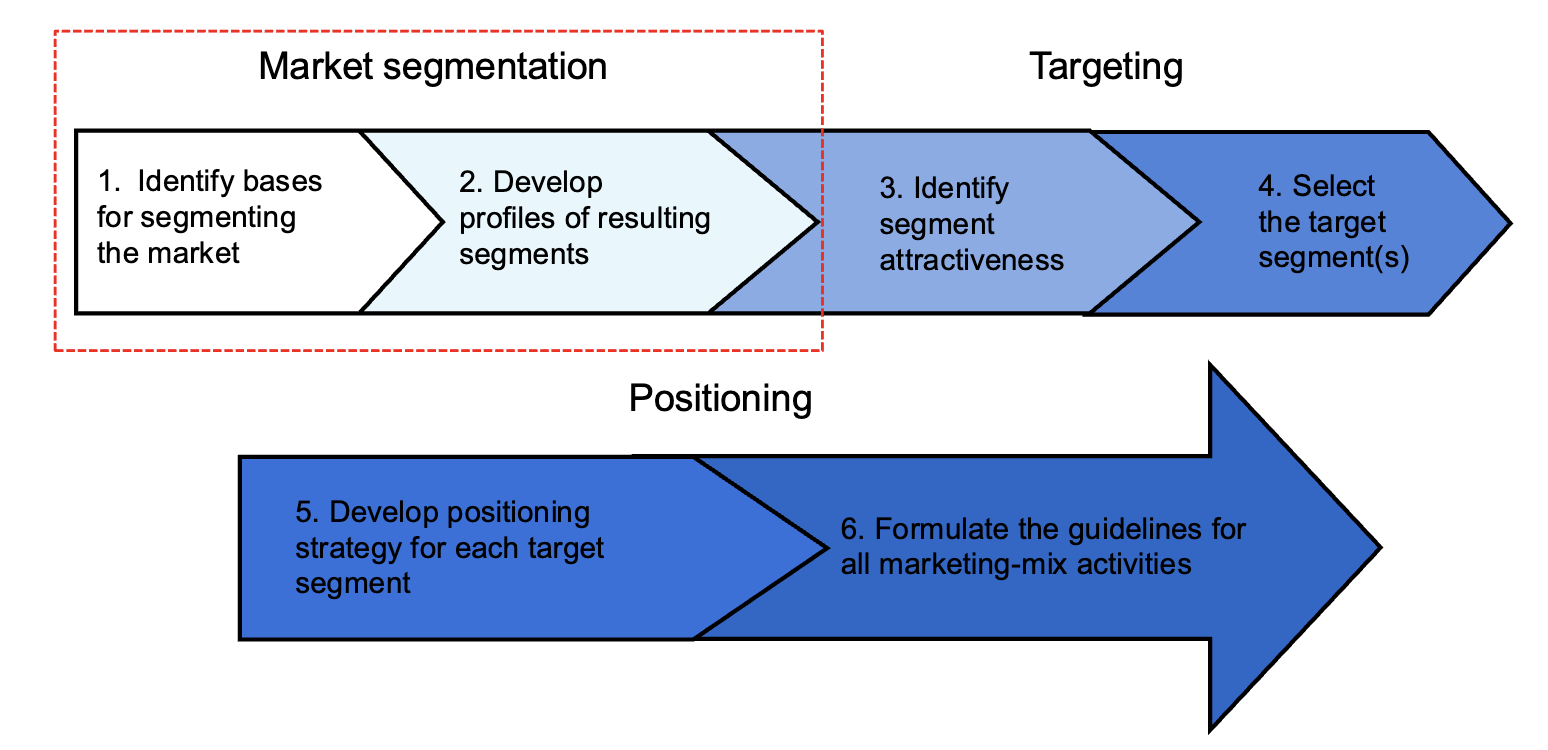
The 6 Steps of the STP Process
- Identify bases for segmenting: Select variables (demographic, psychographic, behavioral) to group buyers.
- Develop segment profiles: Create detailed portraits of resulting segments (e.g. via cluster analysis).
- Evaluate segment attractiveness: Analyze size, growth, competition, and profitability.
- Select target segments: Choose coverage approach (undifferentiated, differentiated, concentrated, micromarketing).
- Develop positioning strategy: Define distinct value propositions for each target segment.
- Formulate marketing-mix guidelines: Align the 4 P’s (Product, Price, Place, Promotion) with segment positioning.
Market Segmentation
Market segmentation is the process of dividing a broad market into distinct groups of buyers with different needs, characteristics, or behaviors who might require separate products or marketing strategies.
Criteria for Effective Segments
For a market segment to be actionable and useful, it must satisfy five core criteria:
- Measurable: The size, purchasing power, and profiles of the segments can be measured.
- Accessible: The market segments can be effectively reached and served.
- Substantial: Segments are large or profitable enough to serve.
- Differentiable: Segments respond differently to different marketing-mix elements.
- Actionable: Effective programs can be designed for attracting and serving segments.
Consumer Market Segmentation Variables
Marketers divide consumer (B2C) markets using five primary categories of variables:
1. Geographic Segmentation
Dividing the market by location, such as nations, regions, states, cities, neighborhood density, or climate.
2. Socio-Demographic Segmentation
Dividing the market based on demographic variables including age, gender, income, education, occupation, household size, and life stage.
- Senior Market Growth: Societal aging in Japan, Europe, the US, and Asia-Pacific (e.g., APAC senior population projected to reach 548M by 2029) makes “Silver Generation / 50+” a rapidly expanding target segment.
Socio-Demographic Twins Fallacy
Relying solely on socio-demographics can be deeply misleading. Two consumers can share identical socio-demographic profiles (e.g., male, age 70+, multimillionaire, university degree, politically active) while possessing completely opposing lifestyles, values, and brand preferences (e.g., Donald Trump vs. Joe Biden). Socio-demographic variables often serve as poor proxies for true behavioral drivers.
| Segmentation Variable | Pros | Cons |
|---|---|---|
| Socio-Demographic | Census data readily available; easy to measure; aids initial reach. | High risk of oversimplification; low insight into underlying motives. |
| Psychographic | Deep insight into values, lifestyle, and social class; highly valid segments. | Requires complex consumer data; harder to measure and reach directly. |
| Benefit Sought | Highly effective for products with unique functional attributes. | High research costs; target groups can be elusive. |
| Behavioral | Directly tracks actual buying frequency, loyalty, and brand usage. | Retrospective (existing customers only); ignores why customers buy. |
3. Psychographic Segmentation
Dividing buyers into different segments based on social class, lifestyle, personal values, or personality traits. This captures the underlying psychological drivers of buying decisions.
4. Benefit Segmentation
Segmenting buyers based on the specific benefits or value they seek from a product.
- Examples: Toothpaste formulated for whitening vs. sensitive teeth vs. enamel protection (e.g., Elmex product lines); or cycle-tracking apps segmented for fertility tracking (Ava) vs. natural birth control (Natural Cycles).
5. Behavioral Segmentation
Dividing buyers based on their knowledge, attitudes, uses, or responses to a product:
- Occasions: Purchases tied to holidays, weddings, or specific events.
- User Status: Non-users, ex-users, potential users, first-time users, regular users.
- Usage Rate: Light, medium, or heavy users.
- Loyalty Status: Brand loyalists, split loyalists, switchers.
Excursus: Building Segments via Cluster Analysis
Developing robust, data-driven segmentations follows a three-stage research pipeline:
- Desk Research: Gathering existing secondary data (industry reports, census data) to establish broad market scope.
- Qualitative Research: Conducting focus groups and in-depth interviews to uncover core customer motivations, attitudes, and unarticulated needs.
- Quantitative Research & Cluster Analysis: Surveying a representative sample and applying Cluster Analysis to classify respondents into homogeneous clusters (high within-cluster similarity, high between-cluster dissimilarity).
Market Targeting
Market targeting involves evaluating the attractiveness of each market segment and selecting one or more segments to enter.
Segment Evaluation Criteria
To evaluate segment attractiveness, firms analyze three core dimensions:
- Segment Size & Growth: Current sales volume, growth rates, and expected profitability.
- Structural Attractiveness: Applying Porter’s Five Forces at the segment level (competitive rivalry, barrier to entry, threat of substitutes, buyer/supplier power).
- Company Objectives & Resources: Alignment with core competencies, Customer Lifetime Value (CLV), and Customer Equity potential.
Market Coverage Strategies
Companies select from four primary coverage strategies ranging from broad mass marketing to hyper-narrow customization:
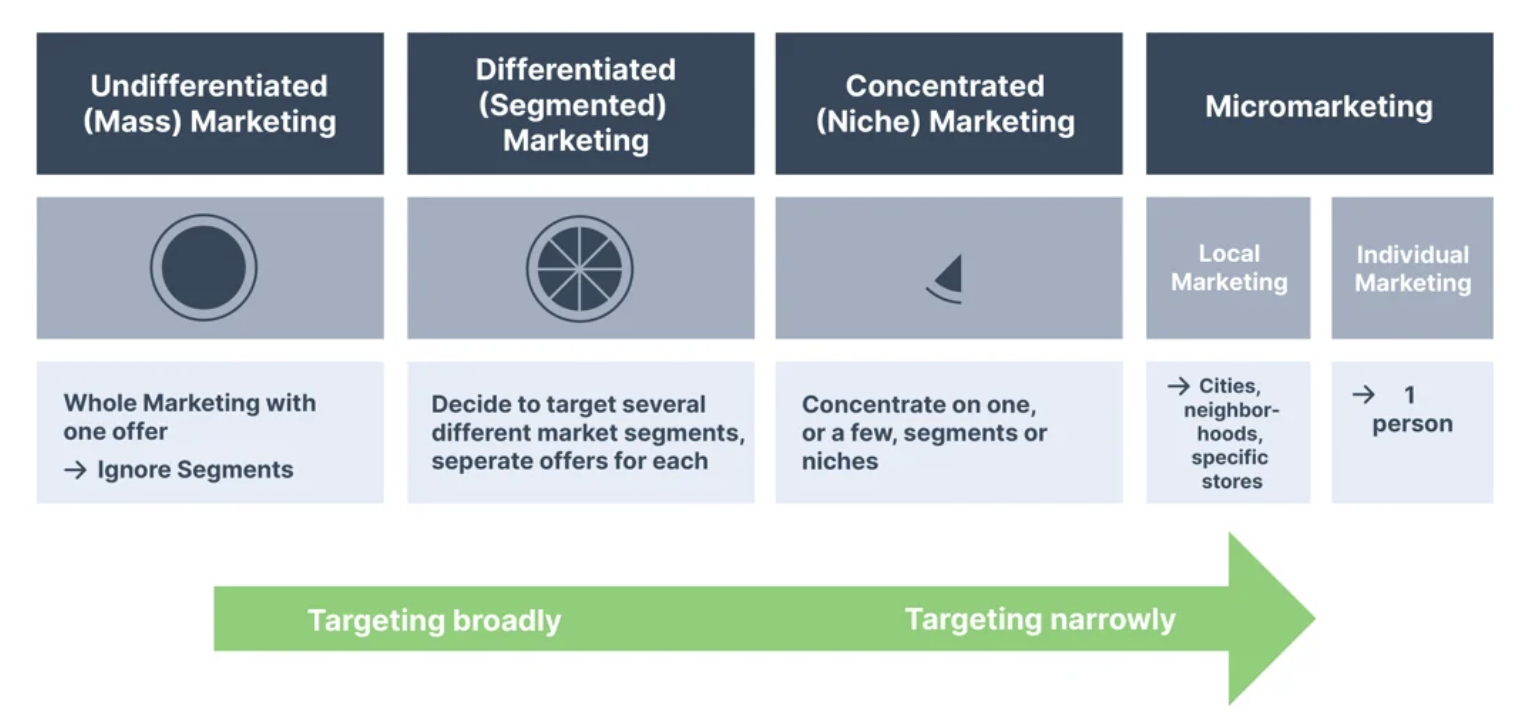
| Strategy | Definition & Approach | Advantages | Disadvantages | Examples |
|---|---|---|---|---|
| Undifferentiated (Mass) | Ignores segment differences; targets whole market with one offer (“one size fits all”). | Low production, inventory, and research costs. | Difficult to satisfy diverse needs; fierce price competition. | Basic commodities, early mass goods |
| Differentiated (Multi-Segment) | Targets several segments with distinct tailored offers for each. | Higher total sales; strong market position; risk diversification. | Resource-intensive; high R&D, production, and marketing costs. | Adidas (Performance vs. Originals vs. Y-3) |
| Concentrated (Niche) | Focuses firm resources on a large share of one or a few specialized niches. | Strong market position in niche; efficient resource use. | High risk if single niche fails or attracts big rivals. | High-end specialized tools |
| Micromarketing (Local/Individual) | Tailors products and promotions to local locations or individual consumers. | Precise targeting; high relevance; leverages digital tracking. | Data privacy concerns; ad-blocker resistance; high unit cost. | Online geo-behavioral targeting |
Market Positioning
Positioning is the act of designing a company’s market offering and image so that it occupies a clear, distinctive, and desirable place relative to competing products in the mind of the target consumer.
The Value Proposition
A brand’s positioning strategy forms its Value Proposition—the full mix of benefits upon which the brand is positioned.
4 Pillars of a Strong Positioning Strategy
- Clarity: Easily understood value message without ambiguity.
- Consistency: Maintained over time across all brand touchpoints.
- Credibility: Backed by genuine product capability and proof points.
- Competitiveness: Offers clear Points of Difference (PoD) over alternatives.
Research Methods for Positioning Strategy
Marketers use two primary empirical approaches to identify brand positioning and map consumer perception:
1. Direct Consumer Surveys
Asking respondents directly via surveys or interviews to rate brands on specific pre-defined attributes (e.g., “How reliable do you perceive Brand X?”).
- Pros: Straightforward; allows direct evaluation of specific attributes of interest.
- Cons: Limited to pre-selected attributes; risk of missing unprompted dimensions that consumers actually use.
2. Perceptual Mapping via Multidimensional Scaling (MDS)
Multidimensional Scaling (MDS) is an advanced statistical technique that maps consumer perceptions into a spatial diagram based on direct pairwise similarity judgments (e.g., rating how similar Brand A is to Brand B), without forcing specific attribute ratings.
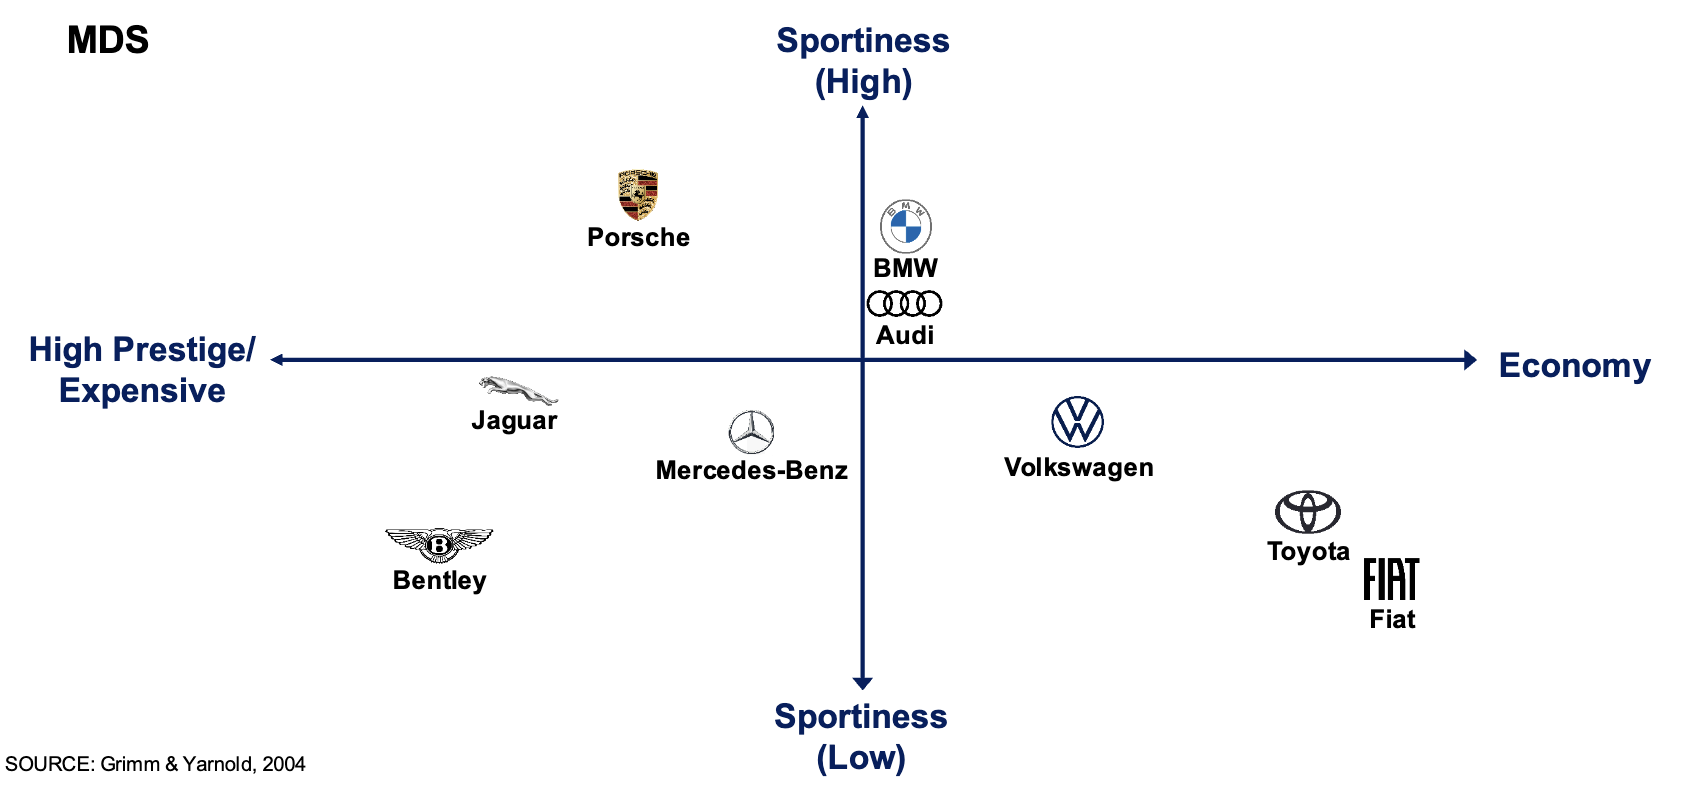
- Pros: Mirrors real-world holistic consumer choice; uncovers unprompted dimensions.
- Cons: Highly complex statistical technique; requires subjective researcher interpretation to label resulting axes.
| Research Approach | Strengths | Limitations |
|---|---|---|
| Direct Attribute Rating | Straightforward, covers all explicit domains of interest. | ”You get what you ask for”—may omit crucial unasked attributes. |
| Multidimensional Scaling (MDS) | Reveals implicit perceptual dimensions; avoids survey bias. | Complex interpretation; axes must be inferred post-hoc. |