Hand-crafted by Flo, auto-checked by AI.
Resources
- Explainers: Introduction, Concept, CAPM
- Slides: CAPM Slides, Debt Cost of Capital, Project Cost of Capital
Cost of Capital
Risk drives expected return. The higher the risk associated with a project, the higher the return investors will demand to achieve a positive NPV. The cost of capital is the minimum return that a project must generate to be considered worthwhile, and it is often estimated using the CAPM.
The risk and return profile of an investment is shaped by many factors, including repayment conditions, maturity, interest rates or required returns, seniority in case of liquidation, collateral, convertibility, and governance rights.
Equity is a residual claim (shareholders are entitled to the remaining cash flows after all other obligations are met), making it riskier for the investor and therefore more expensive for the company. While it does not have a fixed interest rate, expected return on equity must still compensate investors for the risk investors are taking on.
Risk
Before CAPM, investors didn’t distinguish between different types of risk. The model introduced the concept of systematic and unsystematic risk, which are crucial for understanding the cost of capital. A relevant insight of CAPM is that only systematic risk is rewarded with a risk premium, while unsystematic risk can be diversified away and therefore does not command a premium.
- Systematic Risk: Affects the entire market or a large segment of it and cannot be eliminated through diversification. Examples include economic recessions, political instability, changes in interest rates, and natural disasters. Systematic risk is measured by (see below).
- Unsystematic Risk: Specific to a particular company or industry and can be mitigated through diversification. Examples include management decisions, product recalls, or labor strikes. Unsystematic risk is not rewarded with a risk premium.
Within a company, there are two main types of risk that affect the returns to investors:
- Business Risk (Asset Risk): The risk that the uncertainty inherent in a company’s operations will lead to disappointing returns. Influenced by factors such as competition, market demand, and operational efficiency. Affects all capital providers equally, whether they hold debt or equity, because it determines the total economic value the firm generates before any distribution to claimholders.
Business risk is largely unsystematic (though effects like inflation, global supply chain crisis, etc are systematic). - Financial Risk: Arises from capital structure decisions made by management and exists because of the presence of debt. Debt holders have a contractual claim to fixed payments, while equity holders have only a residual claim. The more debt a company takes on, the more volatile the cash flows to equity become.
Financial risk magnifies the systematic risk ().
The amplification effect of debt is called leverage, as it magnifies the returns to equity holders (proportionally). However, it also increases the risk of financial distress and bankruptcy, which can lead to higher costs of capital.
Diversifying Portfolios
Investors can reduce unsystematic risk (business risk) through diversification, but they cannot eliminate systematic risk (market risk). Diversification is simply investing in different assets that are not perfectly correlated, which can help to smooth out returns and reduce the overall risk of the portfolio.
In time-series data, volatility measures the riskiness of investments and reduces with diversification.
Determining CAPM
The Capital Asset Pricing Model (CAPM) is a widely used financial model that describes the relationship between systematic risk and expected return for assets, particularly stocks. It is used to estimate the cost of equity capital, which is a crucial component in corporate finance for evaluating investment projects and determining optimal capital structure.
The CAPM formula is:
where is the expected return on asset , is the risk-free rate, is the beta of asset , and is the expected return of the market portfolio. is known as the market risk premium, which represents the additional return investors require for taking on the risk of investing in the market instead of a risk-free asset.
Beta
is CAPM’s measure of systematic risk, which indicates how much an asset’s returns move in relation to the overall market:
- A of 1 means the asset’s returns move with the market.
- A greater than 1 indicates the asset is more volatile than the market ( means the asset changes at 1.5x the market’s change).
- A less than 1 indicates the asset is less volatile than the market.
Compared to volatility, which measures total risk, focuses solely on systematic risk. An asset with low volatility but high is less sensitive to market movements but carries more firm-specific risk.
, or the unlevered beta, is the systematic risk of a firm’s assets without the impact of financial leverage.
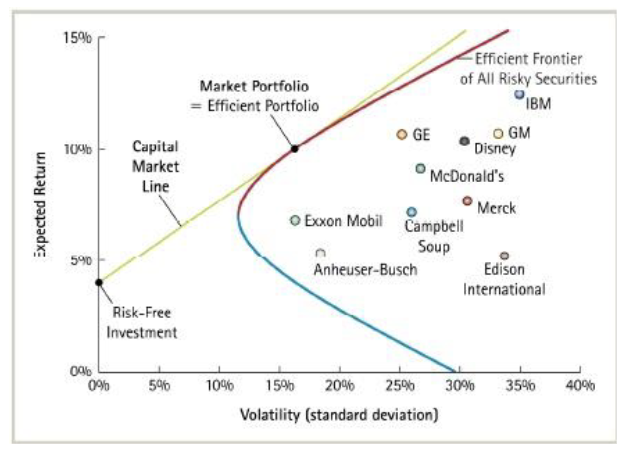
- Efficient Frontier: A curve that represents the set of optimal portfolios that offer the highest expected return for a defined level of risk or the lowest risk for a given level of expected return. Portfolios that lie on the efficient frontier are considered optimal because they provide the best possible return for their level of risk.
- Market Portfolio: A theoretical portfolio that includes all available assets in the market, weighted according to their market capitalization. It represents the overall market and is used as a benchmark for evaluating the performance of individual assets or portfolios.
- Risk-Free Investment: An investment that provides a certain return with no risk of financial loss.
- Capital Market Line: A line that represents the risk-return trade-off of efficient portfolios that combine a risk-free asset with the market portfolio. The slope of the capital market line is the Sharpe ratio, which measures the excess return per unit of risk.
Side note: The slope of this line is the Sharpe ratio, which measures the excess return per unit of risk.
Though CAPM is not perfect, it is used extensively in Corporate Finance, Investment Analysis, and Portfolio Management. It provides a logical framework for thinking about risk and return.
Implementing CAPM
When implementing CAPM and calculating the cost of capital , first construct a value-weighted market portfolio (in practice, typically market indexes like S&P 500) and forecast its market risk premium (what an investor expects to earn above the risk-free rate by investing in the market) using historical average excess (average over large time horizon).
Then, estimate ; the sensitivity to the market portfolio, also using historical data (OLS on excess returns of market vs excess returns on stock).
The risk-free rate is typically the yield on long-term US Treasury securities.
Estimating for New Projects
New projects or companies that are not publicly listed do not have historical stock price data to estimate directly. In such cases, the following approach is used:
- Select a comparable publicly traded company in the same industry with similar business risk and estimate its using historical stock price data.
- Unlever the estimated to remove the effects of financial leverage:
- Re-lever the to reflect the capital structure of the new project:
Where is the corporate tax rate, is the market value of debt and is the market value of equity.
Debt Cost
The cost of debt is the effective rate that a company pays on its borrowed funds. There are different methods to calculating it:
- Yield-to-Maturity Approach: The debt cost of capital equals the yield to maturity on the company’s existing debt, which can be estimated from the market price of the company’s bonds.
- Debt-Rating Approach: If the company does not have publicly traded debt, the cost of debt can be estimated based on the credit rating of the company and the corresponding yield for similarly rated bonds with similar maturity.
- Beta-CAPM Approach: For companies without publicly traded debt, the cost of debt can also be estimated using a beta-based approach, where the cost of debt is calculated as the expected return based on its beta using CAPM.
For investment-grade debt, the yield-to-maturity approach often works well, but for high-yield debt, investors have to adjust for default risk using either expected loss calculations or the CAPM approach.
Bonds → See Bonds
Unlike loans (bilateral contracts), bonds are tradable securities, therefore the company has to offer attractive terms to investors when first issuing them. Options include the principal, the coupon rate, maturity date, and other features such as callability, convertibility, and covenants (terms explained in Bonds). The coupons then go to whoever holds the bond.
When the market demands a different return than the coupon rate, the price of the bond will adjust to reflect this (higher return → lower price). The yield to maturity is the internal rate of return of the bond, which is the discount rate that equates the present value of the bond’s cash flows (coupons and principal) to its current market price.
Where is the yield to maturity, is the probability of default, and is the loss given default.
Project Cost: WACC
Coming back to the fundamental question of whether a project should be undertaken, the project cost of capital is the weighted average cost of capital (WACC), which combines the cost of equity and the cost of debt based on the company’s capital structure.
To determine the cost of capital for a new investment project, the unlevered cost of capital for comparable firms (same industry) is used as a proxy for the project’s risk.
- If a comparable firm has no debt, its equity cost of capital equals its asset cost of capital (). This can be calculated directly via CAPM using the firm’s equity beta ().
- Most firms use debt financing. To isolate the pure operating risk of the project, the financial risk must be unlevered. The asset cost of capital (or unlevered cost of capital) is the weighted average of the equity and debt costs of capital:
Where is the market value of equity, is the market value of debt, is the cost of equity, and is the cost of debt.
Accounting for Significant Cash Holdings
If a comparable firm holds significant cash, it reduces the net risk of the equity because cash is a risk-free asset (). To account for this, net debt () is used in the unlevering formula. This safe cash cushion acts as a stabilizer, artificially dampening the volatility of the stock and pushing the Equity Beta () down.
For firms with exceptionally large cash holdings, net debt becomes negative (). In this scenario, the Asset/Unlevered Beta () mathematically becomes higher than the Equity Beta (). Economically, this does not mean the core business risk has increased; rather, the formula strips away the risk-dampening cash cushion to isolate the true, higher underlying systematic risk of the core business operations.
Tax Considerations
Since interest payments on debt are tax-deductible, the cost of debt is effectively reduced by the tax shield. That’s practically a government subsidy for debt financing.
The tax-adjusted WACC is therefore:
Or in other words, the unlevered cost minus the value of the tax shield:
This has to be considered when evaluating projects, as the tax shield can significantly reduce the cost of capital and make debt financing more attractive.