Hand-crafted by Flo, auto-checked by AI.
Resources
Market research is the systematic collection, processing, analysis, and interpretation of data about markets, customers, and competitors to support marketing decisions. Modern marketing requires empirical evidence to prove that the budget is being utilized effectively and efficiently.
Key Objects of Analysis
- Customer Segments: Identifying and understanding different groups of customers based on demographics, psychographics, behavior, etc.
- Customer Needs: Understanding what customers want and need to design products and services that satisfy those needs.
- Customer Satisfaction: Measuring how well products and services meet or exceed customer expectations to improve retention and loyalty.
- Competitors: Analyzing competitors’ strengths, weaknesses, strategies, and market positions to identify opportunities and threats.
- Market Position: Assessing the brand’s position in the market relative to competitors to inform positioning and differentiation strategies.
- Market Trends: Identifying and analyzing trends in the market to anticipate changes and adapt strategies accordingly.
Data-Driven Marketing
Marketers should have fundamental data skills, not only because those leveraging marketing analytics make decisions at a higher rate, but also because understanding technical coworkers enables efficient project work, being able to analyze data independently brings faster insights, being an analytics translator is a key position for business insights, and data literacy often leads to better questions and more informed decisions.
Market Research vs. Marketing Research
- Market Research: The systematic collection, processing, analysis, and interpretation of data concerning specific markets, customers, competitors, and market-influencing dynamics to support immediate marketing actions (e.g., segment sizes, competitor actions).
- Marketing Research: A much broader field that encompasses market research but also includes foundational academic theories, consumer psychology, brand perception metrics, product testing, pricing experiments, and satisfaction measuring.
Information gained from research can be used instrumentally to solve problems or support decisions; conceptually to provide a better understanding of the problem; or symbolically to justify decisions already made.
The conceptual use of information is especially relevant as most daily decisions are automatic (system 1, contrary to high-involvement decisions system 2). For example, the primary focus of C2C transactions is trust, whereas in B2C it’s customer experience an loyalty, for B2B it’s efficiency and reliability, and in B2G it’s compliance and accountability. The involvement concept also applies here.
Purchase Process
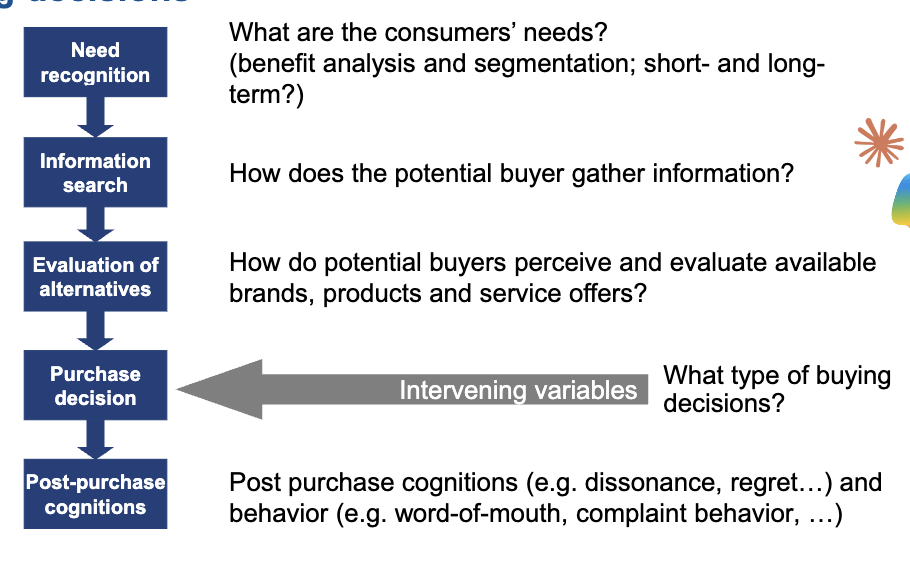
Need Recognition
Need recognition is the first step in the consumer decision process and can be triggered by internal stimuli (e.g., hunger) or external stimuli (e.g., advertising). Marketers can influence need recognition by creating awareness of problems or desires that consumers may not have consciously recognize. This is highly correlated to the search for the ideal and ought self.
Information Search
- Internal Search: Passive approach, consumer’s memory is the main source of information about a product. When interest is relatively low, or enough information is available.
- External Search: Active approach, consumer seeks information from external sources (e.g., online reviews, social media, word of mouth). When interest is high, or not enough information is available.
Research Process
In general, the market research process follows three stages, just like any other research process:
- Planning: Define the research problem, objectives, and design the research approach (e.g., qualitative vs. quantitative).
- Data Collection: Gather data using appropriate methods (e.g., surveys, experiments, focus groups).
- Data Analysis and Reporting: Analyze the collected data using statistical or qualitative methods, interpret the results, and communicate findings to stakeholders.
Common pitfalls when defining the problem, research objectives/questions and hypothesis are: confusing symptoms with problems; defining the problem too broadly or narrowly; implementing the answer into the question; skipping stakeholder consultation.
Six A Framework for Data-Informed Decision Making
Do not start with raw data and try to find arbitrary patterns; always start with a concrete business question or decision that needs to be supported or rejected.
- Ask: Formulate a focused question to answer.
- Acquire: Search for the best available data.
- Analyze: Critically appraise and analyze the data.
- Apply: Integrate data into your mental model and decision process.
- Announce: Decide on a course of action and communicate it.
- Assess: Monitor the outcomes to refine future decisions.
Planning: Types of Research
- Exploratory Research: Aims to explore a problem or situation when there is little existing knowledge. It is flexible and unstructured, often using qualitative methods (e.g., focus groups, interviews, observation).
- Descriptive Research: Aims to describe characteristics of a population or phenomenon. It is more structured than exploratory research and often uses quantitative methods (e.g., surveys, behavioral observational studies, content analysis, panel studies).
- Explanatory (Causal) Research: Aims to establish cause-and-effect relationships between variables. It is highly structured and typically uses experimental methods (e.g., randomized controlled trials, field experiments, a/b tests).
Internal vs. External Study Execution
- Internal: Conducted by the company itself, often using in-house resources and expertise. It allows for greater control over the research process and is more confidental.
- External: Conducted by third-party research firms or consultants. It can provide access to specialized expertise and resources as well as higher acceptance and objectivity.
Internal vs. External Validity
In a field experiment, participants are observed in their natural environment, unknowing that they are taking part in an experiment, while in a lab experiment, participants are observed in a controlled setting. Field experiments have higher external validity but lower internal validity, whereas lab experiments have higher internal validity but lower external validity.
Quality Criteria
Effectiveness vs. Efficiency
- Effectiveness: Doing the right things (e.g., achieving marketing goals).
- Efficiency: Doing things right (e.g., optimizing resource use).
As a recap, objectivity is the extent to which a measurement is free from bias and reflects the true value of what is being measured, while reliability is the consistency of a measurement over time, and validity is the extent to which a measurement accurately captures the concept it is intended to measure.
Data Collection: Sources
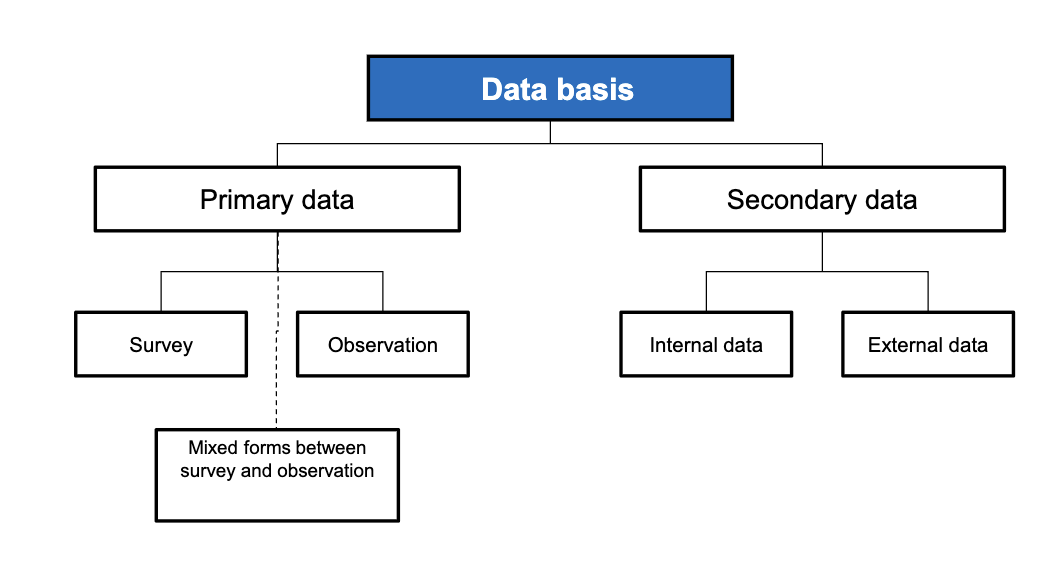
Primary data is collected directly from the source for a specific research purpose, and include surveys (in-depth interviews, group discussions, standardized questionnaires) and observations (online transactions, in-person observations) or mixed (a/b tests, panel research). Secondary data has already been collected and can be internal (e.g., sales data, customer feedback) or external (e.g., industry reports, government statistics).
| Method | Advantages | Disadvantages |
|---|---|---|
| Oral Interview | • Complex topics explained • Follow-ups possible • Lower refusal rate | • Interviewer bias • Social desirability bias • High cost |
| Written Survey | • Low cost • No interviewer bias • Time to think • Large sample size | • Low response rate • Poor representativeness • No clarification |
| Telephone Interview | • Flexible timing & callbacks • Fast results / low cost • Follow-ups possible | • Low response willingness • No non-verbal cues • Hard to reach some groups • Limited question complexity |
| Online Survey | • Low cost • High reach / quick data | • Target population uncertainty • Self-selection bias • Unserious answers (anonymity) |
First-, Second-, Third-, Zero-Party Data
- First-Party Data: Data collected directly by the company from its customers (e.g., purchase history, website behavior).
- Second-Party Data: Data collected by another company and shared with the company (e.g., data from a partner or affiliate).
- Third-Party Data: Data collected by an external organization that is not directly involved in the transaction (e.g., data brokers).
- Zero-Party Data: Data that customers intentionally and proactively share with a company, often through surveys or preference centers, providing insights into their preferences and intentions.
Data Quality
Data quality can be assessed by six factors:
- Completeness: The extent to which all necessary data is present.
- Uniqueness: The degree to which data is free from duplicates.
- Concistency: The degree to which data is the same across different datasets or sources.
- Validity: The extent to which data conforms to defined formats or rules.
- Accuracy: The degree to which data correctly represents the real-world values it is supposed to capture.
- Timeliness: The degree to which data is up-to-date and available when needed.
Identifying Willingness to Pay
- Direct Customer Surveys: Asking customers directly about their willingness to pay for a product or service. Simple, targeted, and high validity for industrial goods, but price is considered in isolation and risks a discrepancy between stated and actual willingness to pay as well as response bias.
- Conjoint Analysis: A statistical technique that analyzes how customers value different attributes of a product or service, including price. It provides insights into trade-offs customers make but is complex and may not capture all relevant factors influencing willingness to pay. See Conjoint Analysis – Understanding Preferences.
- Incentive Alignment: Offering customers a real or hypothetical scenario where they have to make a purchase decision, allowing researchers to observe actual behavior rather than relying on self-reported data. This method can provide more accurate insights into willingness to pay but is more costly and time-consuming to implement.
- The BDM model is a quasi-auction mechanism where participants select a price, then must purchase the product if its randomly determined price is below that.
Socially Desirable Responding
A tendency for respondents to answer questions in a manner that will be viewed favorably by others, which can lead to biased or inaccurate data. This is particularly relevant in surveys about sensitive topics (e.g., income, health behaviors) and can be mitigated by ensuring anonymity, using indirect questioning techniques, or employing validated scales that account for social desirability bias.
Three R’s in Experiments
- Randomization: Randomly assigning participants to different groups to ensure that any differences observed are due to the treatment and not pre-existing differences.
- Replication: Repeating the experiment to confirm that the results are consistent and not due to chance.
- Reduction of Variance: Reducing potential confounding factors that could influence the results, such as controlling for extraneous variables or using a homogeneous sample.
Analysis
Sampling is explained in Inferential Statistics, scales of measurements are explained in Descriptive Data Analysis. The usual data analysis workflow applies: clean data (missing values, outliers, encoding); descriptive analysis (statistics, visualizations); inductive analysis (generalizing to population using regression, inference); interpretation (linking results to theory, business implications, limitations).
This uses statistical methods to solve problem variations, such as data simplification (factor/cluster analysis for customer segments), linking variables to outcomes (multivariate regressions for revenue forecasting), or resource optimization (linear program mapping for picking retail locations).
Applying Outcomes
There are three fundamental options for using data-driven decisions:
- Decision Support: Using data to inform and guide human decision-making, providing insights and recommendations while allowing for human judgment and intuition.
- Decision Augmentation: The system recommends a decision based on data analysis, but the final decision is made by a human.
- Decision Automation: The system makes decisions and takes actions automatically based on data analysis, without human intervention.
These research findings have to be continuously assessed from business (check need), data science (data and model quality), and IT (deployment) side to ensure they are actionable, non-obvious, grounded in real behavior, and linked to specific business outcomes or decisions.
Finally, data storytelling is an important aspect of market research; a structured approach to blending data, visuals, and a strong narrative to create a story that can influence and drive change.
Readings
Readings
- Petty & Cacioppo (1986): Elaboration Likelihood Model This 83-page reading is relevant for the exam
- Viglia et al. (2021): Good Experiments in Marketing
- Chambliss: Causation and Experimental Design
- Petty & Cacioppo (1986) – Elaboration Likelihood Model: Proposes that persuasion occurs via two routes: the central route (high elaboration, deep scrutiny of arguments) and the peripheral route (low elaboration, reliance on simple cues). Attitudes changed via the central route are more persistent and predictive of behavior.
- Viglia et al. (2021) – Good Experiments in Marketing: Defines key tenets of experimental design, emphasizing the need for accurate manipulation and randomization to establish causality. It discusses the balance between internal validity (causal reliability) and external validity (generalizability).
- Chambliss – Causation and Experimental Design: Outlines the three criteria for identifying causal effects: empirical association, temporal priority, and nonspuriousness. True experiments are the “gold standard” because they use comparison groups and random assignment to meet these criteria.