Resources
Cost-volume profit analysis is a tool to determine the quantity of products that need to be sold to reach a certain profit target (usually break-even). It helps to analyze the relationship between costs, volume, and profit, and how variable and fixed costs impact the company’s risk. It answers questions about the optimal level of automation and in-house vs. external procurement.
Cost-Volume Profit Analysis
Cost-Volume and Contribution Margin Models
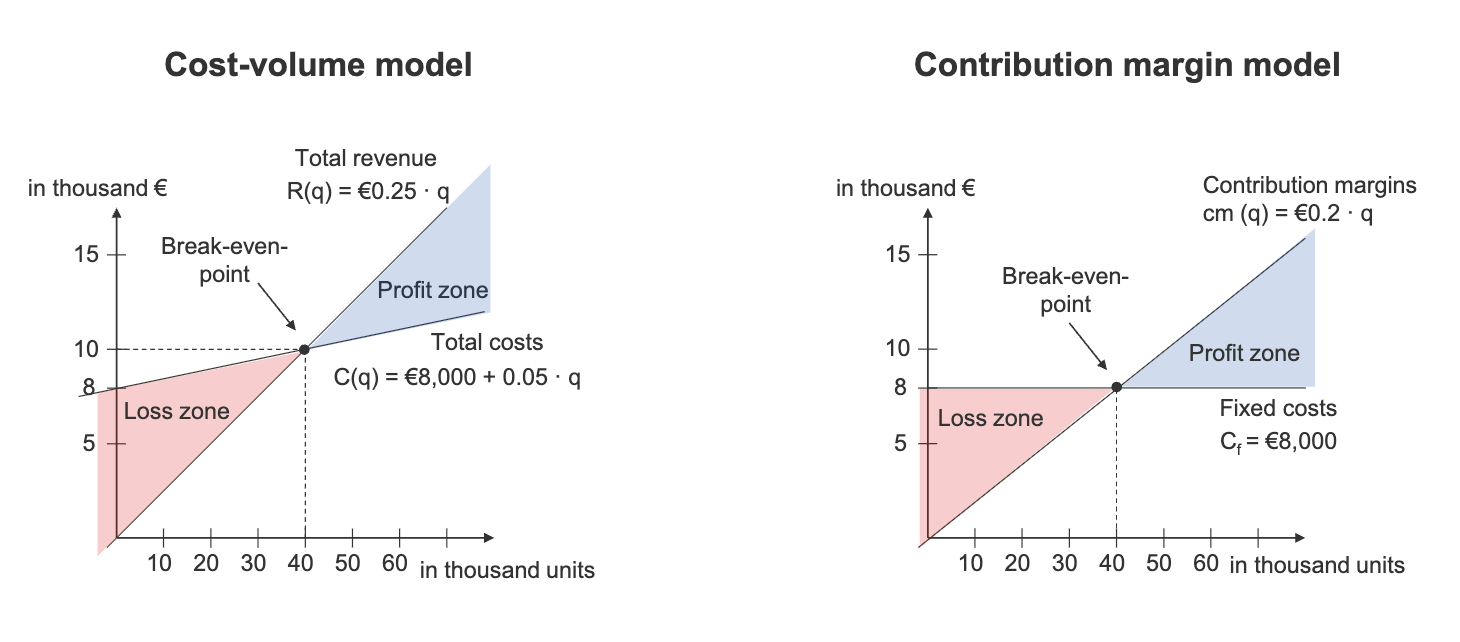
Cost-volume profit analysis can be performed using either the cost-volume model or the contribution margin model. The cost-volume model focuses on the relationship between costs, volume, and profit, while the contribution margin model emphasizes the contribution margin per unit and its impact on profitability. Both models can be used to analyze break-even points, target profits, and the effects of changes in costs and prices on profitability.
- Profit in cost-volume:
- Profit in contribution margin:
Limitations
- Revenues depend only on output quantity: Other factors such as price changes, market demand, and competition are not considered.
- Costs and revenues are linear: Non-linear increases in costs (e.g. expansion) require an extended version of the model.
- Variable/fixed costs and sales price are known and constant: In reality, these may fluctuate due to various factors.
- Profit maximizing and short-term: The entity maximizes profit and disregards the time value of money.
Single Products
For a single product, the break even quantity and critical sales revenue (where total profit is zero) can be calculated as:
Note that , which may be adjusted to a different Target Profit. is the contribution margin.
Multiple Products
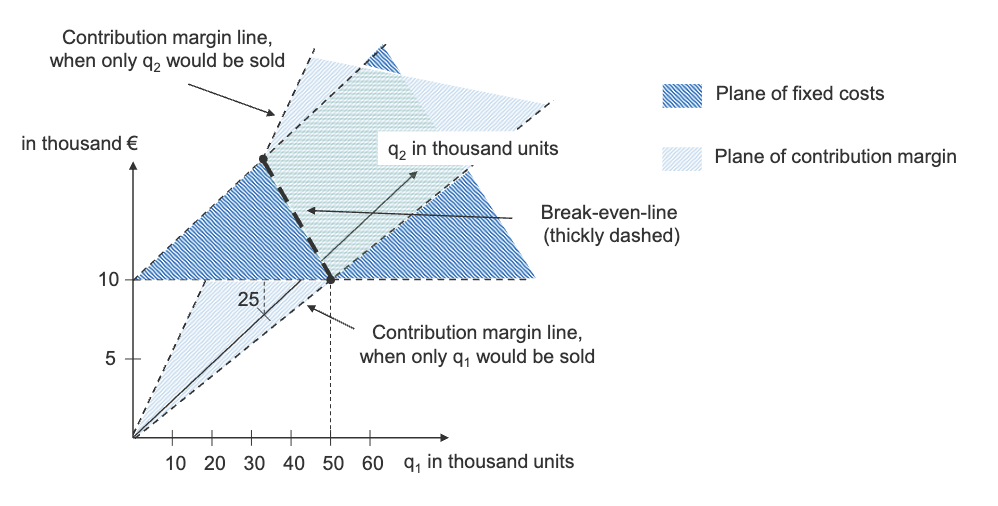
For two products, the break-even quantity of one product depends on the quantity of the other product:
Firms often assume a certain mix of products sold for the break-even analysis. Given a constant sales mix , the break-even line can be calculated at or another value:
Note that is the combined fixed cost of both products, and the contribution margin is weighted by the sales mix.
Target Profit
To achieve a target profit different from 0, simply use a different value for in the same formula:
Target Return
To achieve a target return on sales (ROS, the ratio of profit to sales revenue), we can express the target profit as a percentage of sales revenue:
Sensitivity Analysis
In the context of cost-volume profit analysis, sensitivity analysis examines how changes in key variables (such as sales price, variable costs, fixed costs, and sales volume) affect the break-even point and profitability. This is done using simulations in spreadsheets or by differentiating the profit function with respect to the variable of interest. For an example, see slide 274.
Margin of Safety
The margin of safety expresses how severe a decrease in sales volume can be before the company incurs losses, or by which percentage the expected sales volume can decrease before reaching the break-even point . It can be calculated as:
Cost Structure Flexibility
Cost-volume analysis can also answer at which volumes it’s preferable to produce a product/service in-house or to outsource it (which typically transforms fixed costs into variable costs). This does not consider strategic decisions, of course.
This is done by determining the profit functions for each alternative and finding their intersection point, which indicates the volume at which both alternatives yield the same profit. For an example, see slide 283. For volumes below the intersection point, the alternative with lower fixed costs (e.g. outsourcing) is more profitable, while for volumes above the intersection point, the alternative with lower variable costs (e.g. in-house production) is more profitable.