Hand-crafted by Flo, auto-checked by AI.
Resources
Risk and Uncertainty
Expected Return
The expected return of an investment is the weighted average of all possible returns, where the weights are the probabilities of each return occurring.
The total risk variation is captured by the difference in cashflow outcomes across different scenarios relative to the initial investment.
Risk is measurable uncertainty (e.g. rolling a dice), whereas uncertainty is unmeasurable risk, where probabilities and outcomes cannot be known. This is also explained in Decision Analysis. In reality, the line between risk and uncertainty is often blurred, but tends towards uncertainty.
Under risk – various investments with known possibilities and outcomes, an expected value can simply be calculated:
However, only one value will ever materialize and may not match this weighted average.
Under uncertainty – we may not know all outcomes and cannot assign probabilities, an expected value cannot be determined. This might occur when a new technology is launched and it’s not possible to predict market size, adoption rate, or secondary uses.
Time Value
The time value of money is the future value of a present amount of money: The current amount adjusted for the expected return over a given time period. In the opposing way, present value is used, which is also called discounting and discussed in Discounting.
Formulas:
- Future Value (FV):
- Present Value (PV):
Net Present Value
Future cash flows are discounted to give their present values. The sum of all present values (including the negative value of the initial investment) is the net present value (NPV), which is used to evaluate the attractiveness of an investment or project.
If NPV > 0, the investment is expected to generate more value than its cost, and is therefore considered a good investment.
Internal Rate of Return
The internal rate of return (IRR) is the discount rate that makes the net present value (NPV) of a particular project equal zero. It represents the expected annualized return on an investment, and is used to evaluate and compare the profitability of different investments or projects. Generally, a higher IRR indicates a more attractive investment opportunity.
If NPV is positive, IRR is greater than the discount rate; if NPV is negative, IRR is less than the discount rate. If NPV is zero, IRR equals the discount rate.
IRR alone should not be used to compare projects of different scale as it doesn’t scale linearly. A small project with a high IRR may generate less total value than a large project with a lower IRR.
Terminal Value
Terminal value is the estimated value of an investment beyond a forecast period, given a constant growth rate to perpetuity. It’s the NPV of all future cash flows, beyond the period.
where: is the growth rate, and is the discount rate. Terminal value is often used in discounted cash flow (DCF) analysis to estimate the value of a business or project at the end of a forecast period. This method with static growth assumptions is also called the Gordon Growth Model.
Payback Rule
A simple method for evaluating investments, which calculates the time required to recover the initial investment from the cash flows generated by the project. The payback period is the length of time it takes for the cumulative cash flows to equal the initial investment. While this method is easy to understand and use, it has limitations, such as ignoring the time value of money and cash flows that occur after the payback period.
Profitability Index
The profitability index (PI) is a ratio of the present value of future cash flows to the initial investment. It is used to evaluate the attractiveness of an investment or project, with a PI greater than 1 indicating a good investment opportunity. It’s useful when resources are limited and projects need to be ranked based on their return per unit of investment.
Edge Cases
The IRR’s interpretation depends on the cash flow profile of the investment. The standard IRR rule (invest if discount rate is lower than IRR) can only be reliably used when all costs precede all benefits – so only one prefix change.
For positive cash flows, NPV increases with higher discount rates, and IRR should be higher than the discount rate. Here, NPV and IRR move in the same direction. However, for negative cash flows, NPV decreases with higher discount rates, and IRR should be lower than the discount rate. Here, NPV and IRR move in opposite directions. This can lead to multiple IRRs or no IRR at all, which is a common pitfall when using IRR for investment analysis.
Multiple IRRs
As a general rule, there can be up to as many IRRs as there are prefix changes in the cash flow stream.
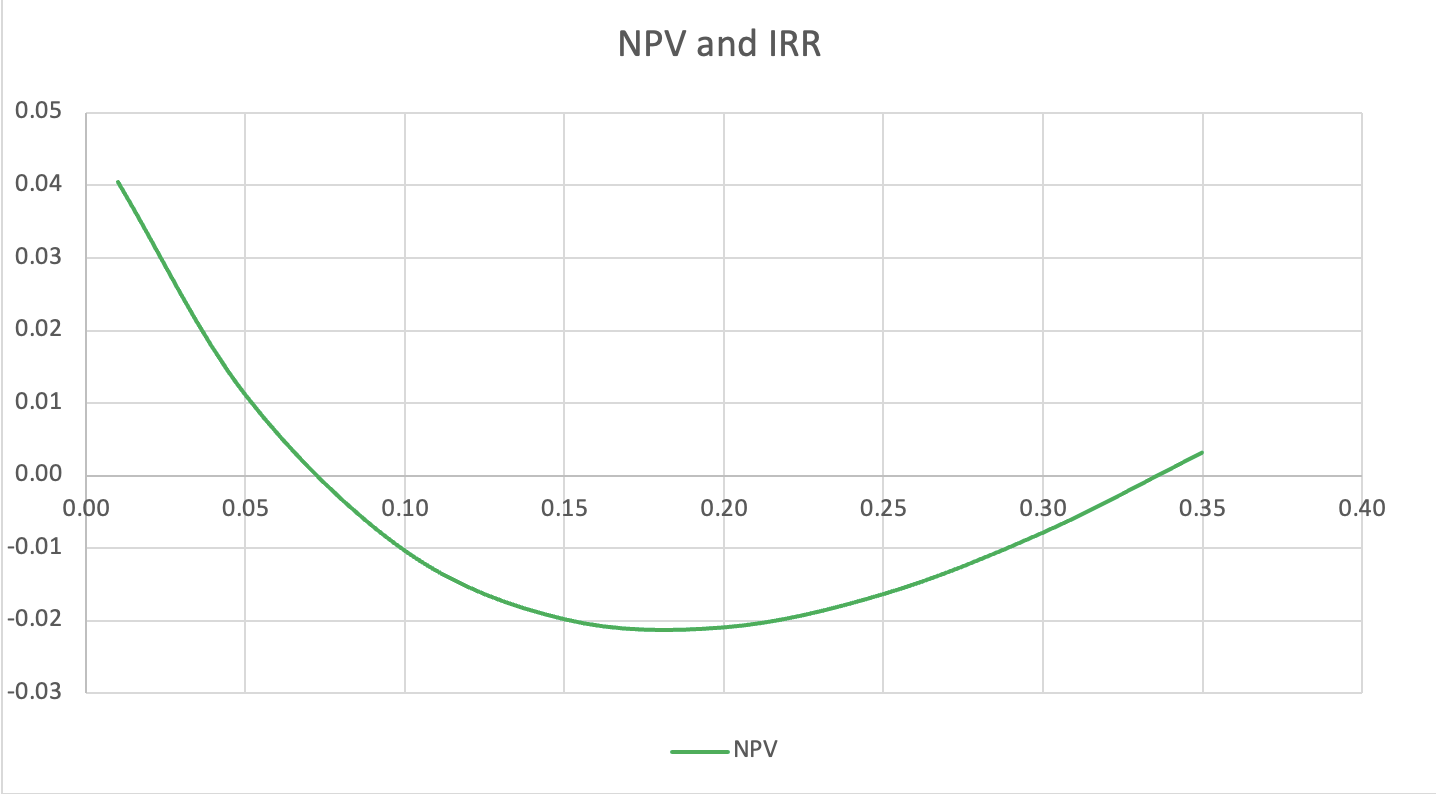
No IRRs
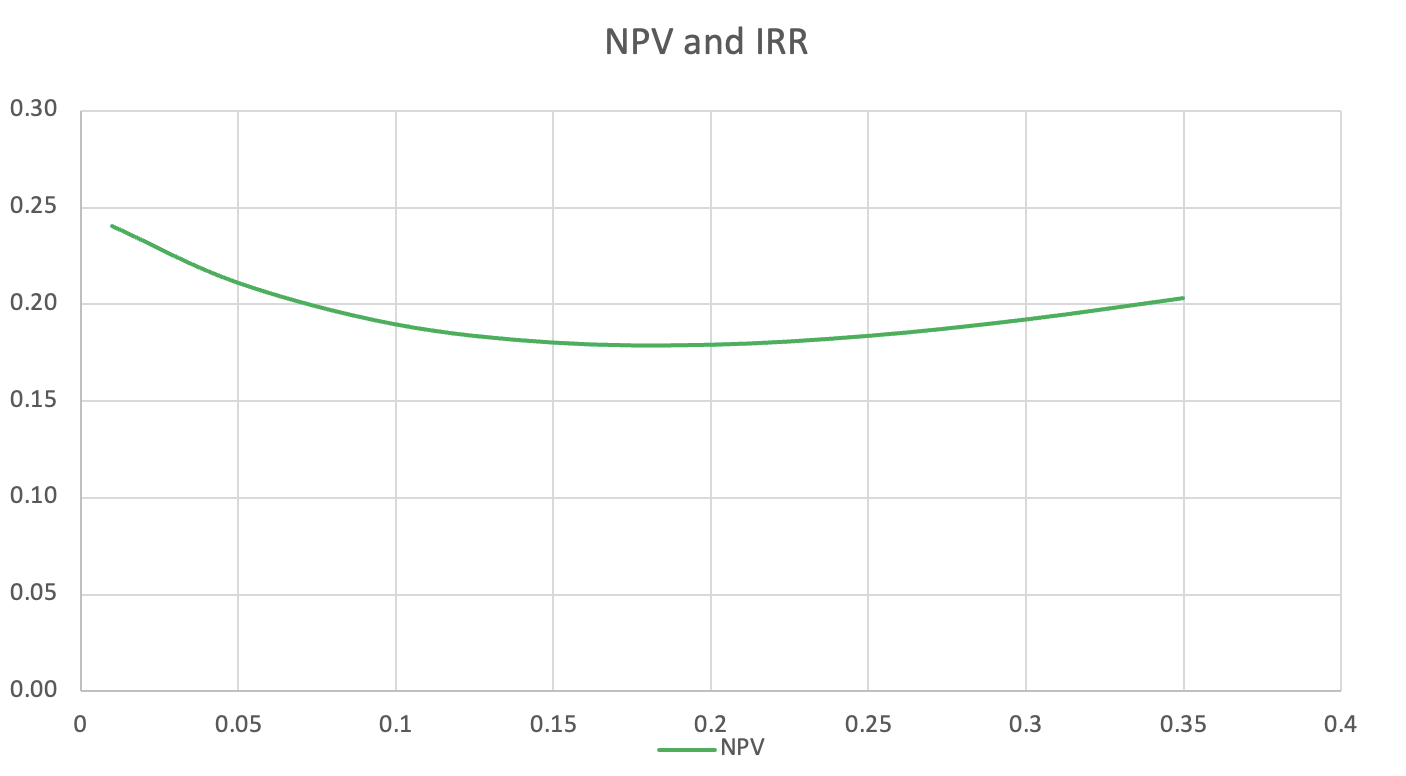
When the NPV is always negative or always positive, there is no discount rate that makes the NPV equal to zero, and therefore no IRR exists. This can occur when the cash flow stream has only one sign (all positive or all negative) or when the cash flows are irregular and do not follow a consistent pattern.