Financial analysis is reading, analyzing, and interpreting financial statements (as taught in Financial Accounting) to understand a company’s financial health and performance. It involves evaluating the company’s profitability, liquidity, solvency, and efficiency using various financial ratios and metrics. The goal of financial analysis is to provide insights into the company’s financial position, identify trends, and make informed decisions for investors, creditors, and management.
Key questions are: How profitable is this company?, How risky tis this investment?, Are resources used efficiently?, Will financial obligations be met?, Is this company worth investing in?
Financial Statement Analysis is also covered in the Financial Accounting module, however this module focuses on understanding how well a company is executing each step of the investment cycle.
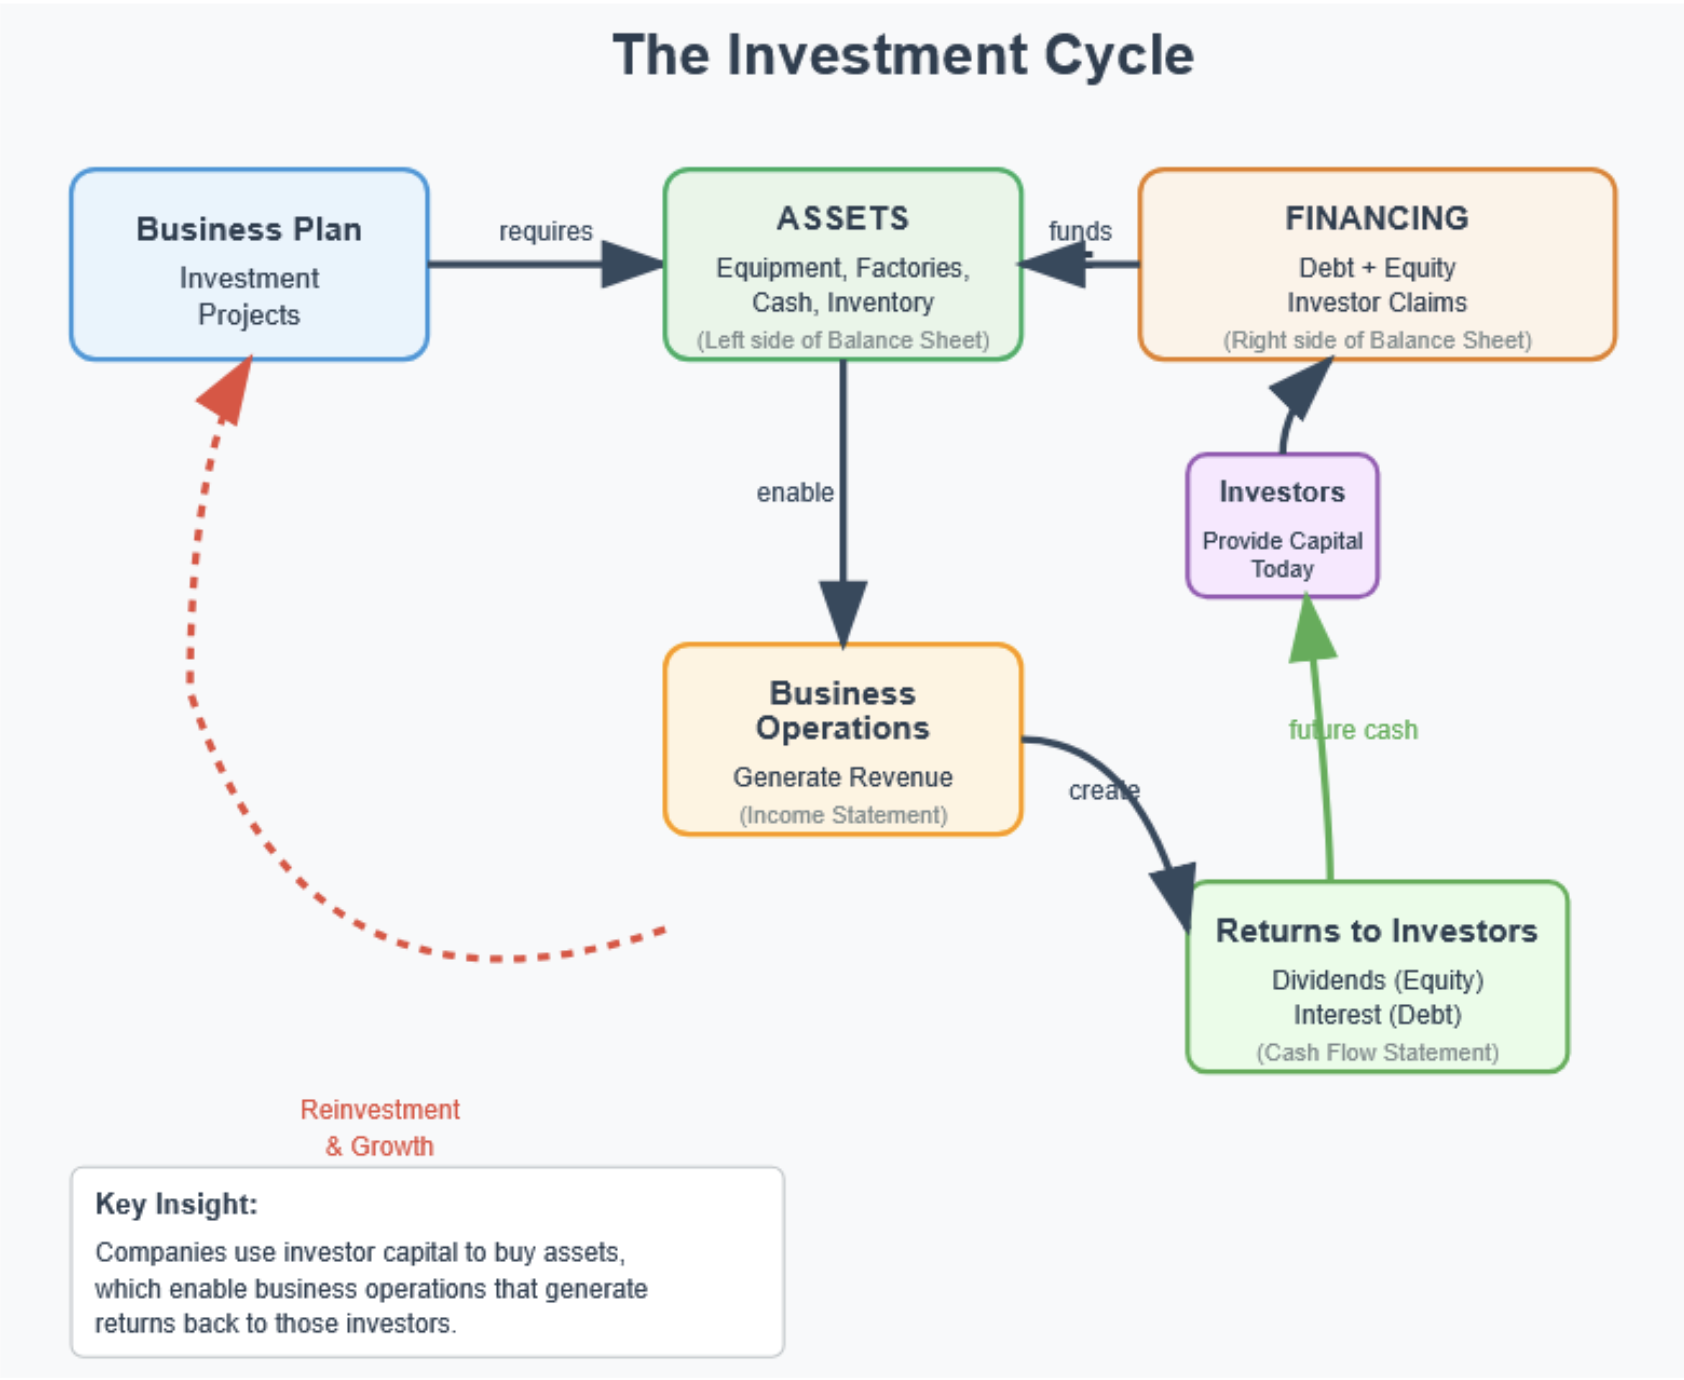
Investment Cycle
The balance sheet documents the company’s assets – what it requires to operate (top green) – as well the source of financing – debt and equity (top orange).
The income statement reveals how effectively business operations generate profit from these assets (bottom orange). The bottom line is profit that belongs to shareholders.
The cash flow statement tracks actual cash flows throughout the investment cycle (bottom green), capturing the return to investors.
Not all profit is distributed to investors, but companies use parts of it to fund new business plans and investment projects to restart the cycle.
Balance Sheet Analysis
Key questions:
Uptime Alert for {{ $('Config').item.json.uptime_name }}
{{ servicename }} is down
Service {{ servicename }} has been unavailable for {{ wait_mins }} minutes.
The team has been notified and we'll send you another notification once the service returns back to normal.
We're on this. If you have questions, please message the team.
You received this email because you have been configured as contact for {{ servicename }} in TBO's uptime management.
- How does this compare to competitors?
Shareholder’s Equity
Book Value vs Market Value
The book value of equity can be negative (if liabilities exceed assets), however, many of a firms valuable assets may not be captured on the balance sheet (IP, brand value, future expectations, etc). Contrary, the market value of equity (market capitalization) is based on the current stock price and can be much higher than book value, especially for companies with significant intangible assets. Therefore, market value is often a better indicator of a company’s true worth than book value, particularly for firms in technology or service industries where intangible assets play a major role.
Market-to-Book Ratio
M/B, also called Price-to-Book ratio (P/B), this ratio compares the market value of a company’s equity to its book value. It is calculated as:
Market-to-Book Ratio=Book Value of EquityMarket Value of Equity
A high ratio suggests growth stocks (lots of intangible assets, high future growth expectations), whereas a low ratio may indicate value stocks (undervalued, more tangible assets).
Successful companies have a ratio larger than 1.
Enterprise Value
EV or TEV for Total Enterprise Value measures the firm’s underlying business operations and assets. It’s simply the balance (since Assets=Liabilities+Equity) minus cash and cash equivalents (since they are not part of the underlying business and could be paid out).
Enterprise Value=Market Value of Equity+Total Debt−Cash and Cash Equivalents
Remembering that total debt minus cash and short-term investments is called net debt. This assumes that book debt is equal to its market value.
Income Statement Analysis
Key questions:
Uptime Alert for {{ $('Config').item.json.uptime_name }}
{{ servicename }} is down
Service {{ servicename }} has been unavailable for {{ wait_mins }} minutes.
The team has been notified and we'll send you another notification once the service returns back to normal.
However, this does not take into account potential dilution from convertible securities, stock options, or other financial instruments that could increase the number of shares outstanding. Therefore:
Diluted Earnings per Share (Diluted EPS) considers the impact of all potential shares that could be created from these financial instruments. It provides a more conservative measure of a company’s profitability and is calculated as:
We're on this. If you have questions, please message the team.
You received this email because you have been configured as contact for {{ servicename }} in TBO's uptime management.
- Is it generating enough cash to fund growth and reward investors?
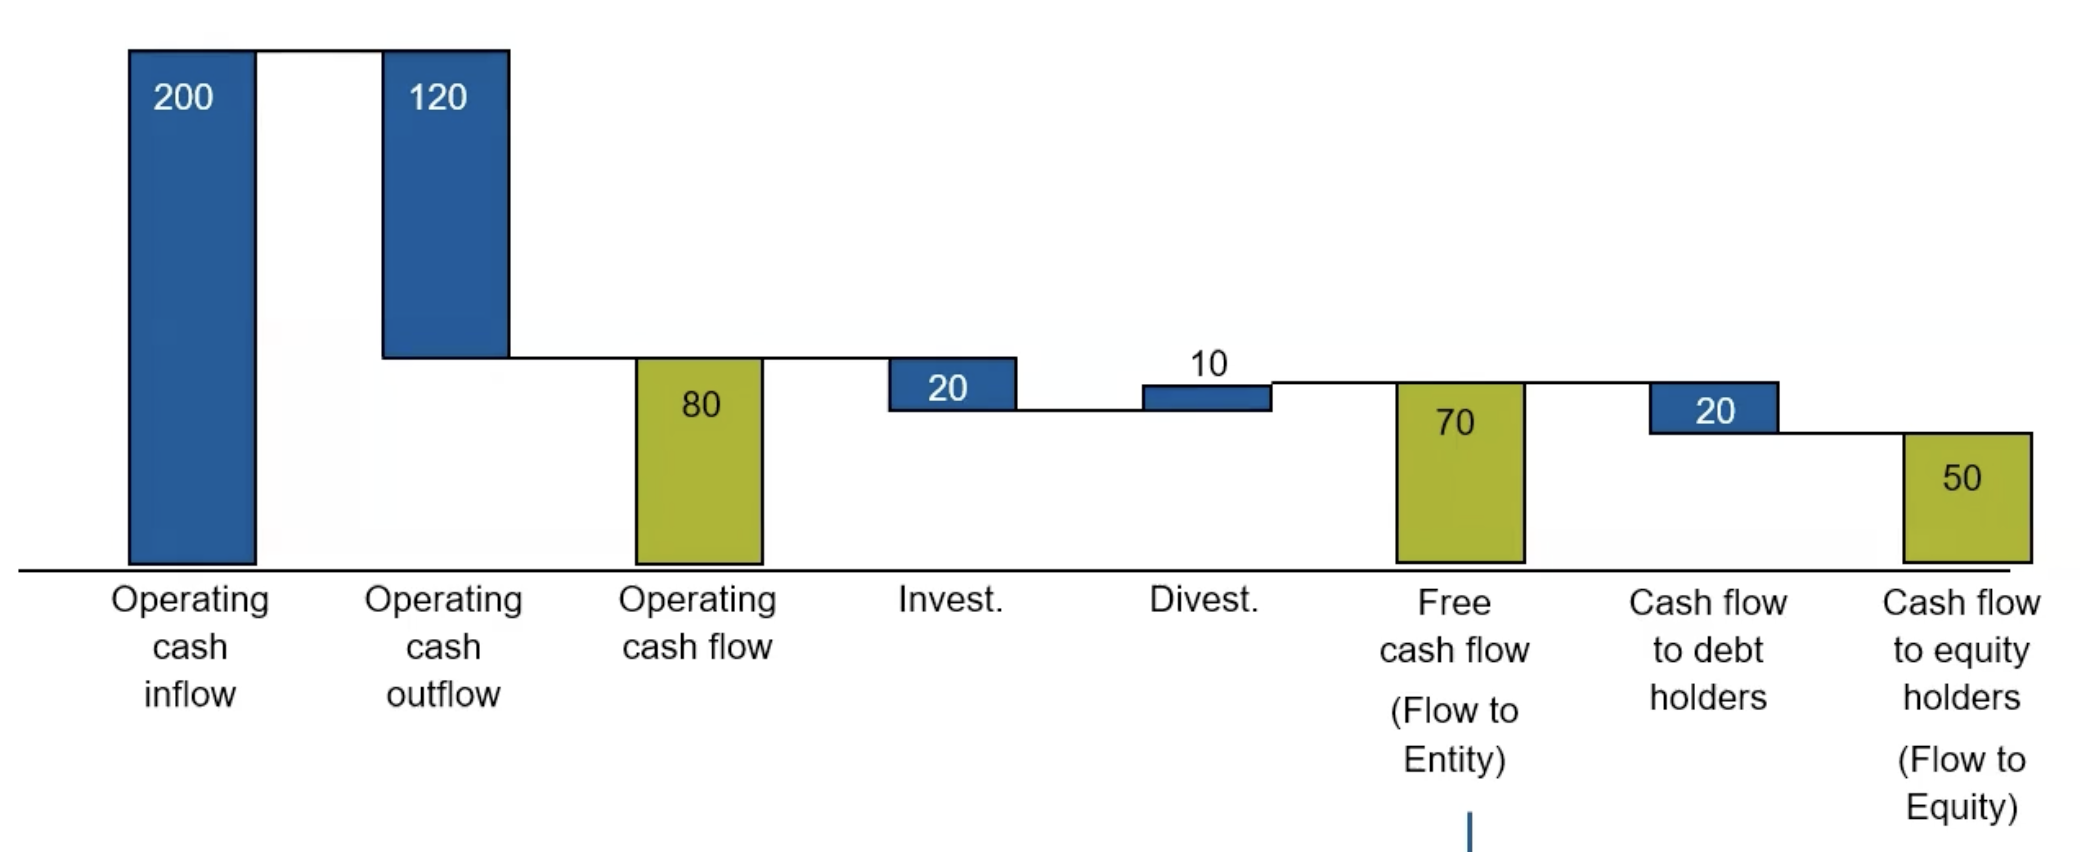
Free Cash Flow (FCF) is the cash generated by a company’s operations and investment that is available for distribution to its capital providers (debt and equity). It’s a core concept in corporate finance:
FCF=Net Income+Non-Cash Expenses−Changes in Working Capital−Capital Expenditures=Operating Cash Flow−Capital Expenditures
Depreciation leads to positive free cash flow due to tax savings (depreciation is added back to the decreased net income when calculating FCF). The tax shield (deductible expense without cash outflow), which is the reduction in taxes due to depreciation, is a real cash benefit to the company and creates value.
Ratios
Leverage Ratios
Measure
Definition
Interpretation
Debt-Equity Ratio
Total EquityTotal Debt
Measures the firm’s reliance on debt as a source of financing. Can be measured using book or market values.
Debt-to-Capital Ratio
Total Equity+Total DebtTotal Debt
Proportion of total capital that is financed by debt.
Debt-to-EV Ratio
Market Value+Net DebtNet Debt
Measures leverage relative to Enterprise Value. Net Debt=Total Debt−Cash & Short-term investments
Equity Multiplier
Book Value of EquityTotal Assets
Indicates how many dollars of assets are supported by one dollar of equity.
Valuation Ratios
Measure
Definition
Interpretation
Price-to-Earnings (P/E) Ratio
Net IncomeMarket Capitalization or Earnings per ShareShare Price
Helps investors assess the market value of a firm relative to its earnings.
EV to EBIT
EBITMarket Value of Equity+Debt−Cash
Valuation relative to operating profit. Useful for intra-industry comparisons.
These ratios measure how efficiently a company converts revenue into profit.
Measure
Definition
Interpretation
Gross Profit Margin
RevenuesGross Profit
Profit contribution of products/services sold. Growth indicates how procurement prices change. Offers information on possible price cuts if necessary.
Operating Profit Margin (EBIT Margin)
RevenuesEBIT
Profit contribution of operating activities before financial performance. Indicates earnings power (and its development). Useful for cross-industry international comparisons. Higher: Stronger impact of sales on earnings. Negative over periods: For established companies, business model should be reconsidered.
Net Profit Margin
RevenuesNet Income
The ultimate measure of profitability after all costs. Shows how much of each dollar in revenue is kept as profit.