Hand-crafted by Flo, auto-checked by AI.
Resources
Cost functions model costs to help managers understand how they change with different levels of production or activity. They are essential for budgeting, forecasting, and decision-making in cost accounting.
Cost Functions and Drivers
Costs functions describe the relationship of cost drivers and the effective cost, whereas cost drivers represent the independent variables of the cost function.
Basic Cost Functions
As usual, fixed cost function values do not change with production outcome, while variable costs are proportional to output.
Variable costs can relate to the production level in different ways:
- Proportional Costs increase in direct proportion to the level of production or activity.
- Convex Costs increase at an increasing rate as production or activity increases, often due to factors like overtime pay or equipment wear and tear.
- Concave Costs increase at a decreasing rate as production or activity increases, often due to economies of scale or learning effects.
Sticky Costs
Qianhua Ling (article) describes the phenomenon where increased fixed costs due to higher production levels do not symmetrically decrease when production levels fall, leading to “sticky costs” that do not adjust downward as quickly as they adjust upward.
Entities with high committed resources (e.g., long-term leases, large workforce) or intangible assets are more likely to experience sticky costs, as well as financially stable companies that are able to absorb superfluous fixed costs.
Sticky costs occur due to various reasons: it may be cheaper to keep resources (e.g. labor) idle than potentially reacquiring them later on; when management is optimistic about future growth; to protect labor market reputation; illiquid resources.
Combined Cost Functions
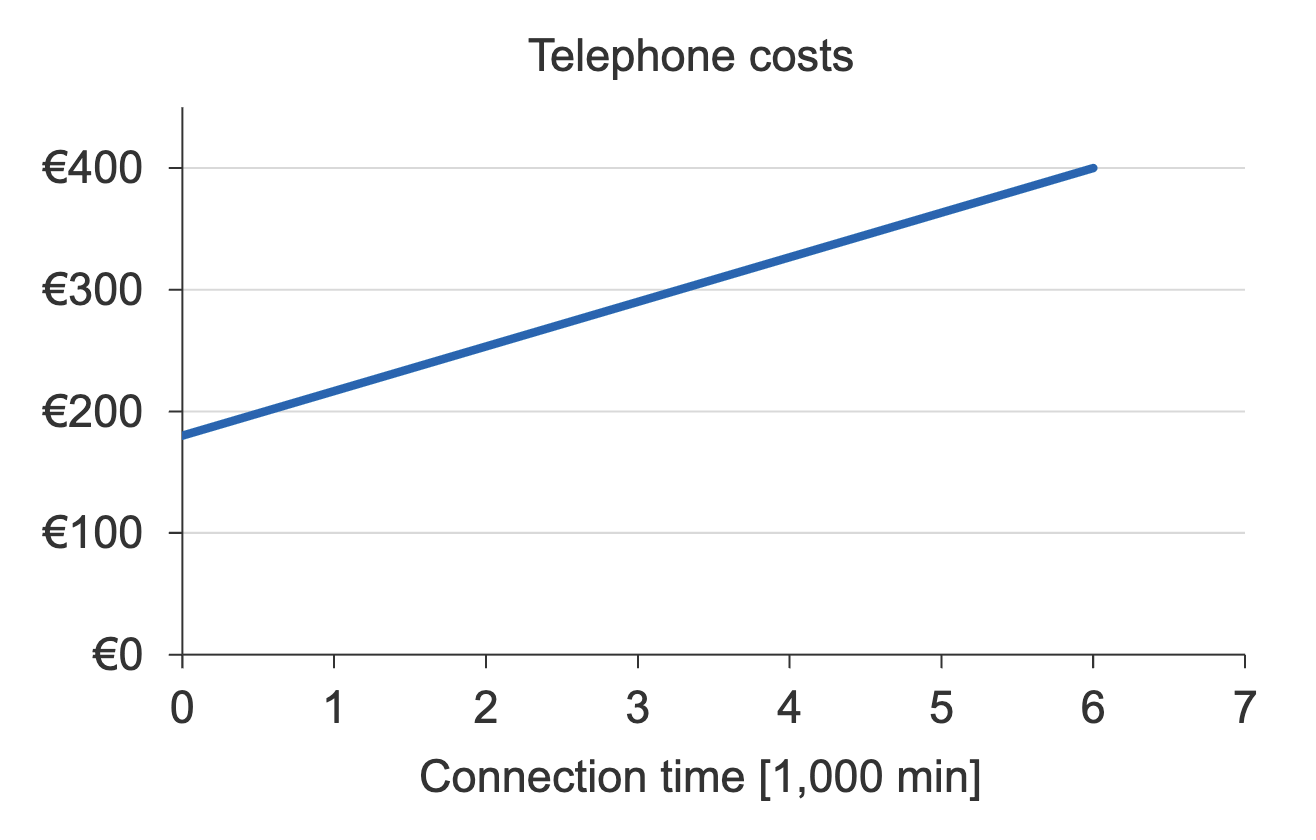
- Semi-Proportional Costs are a combination of fixed and variable costs, where the total cost is the sum of a fixed cost component and a variable cost component that changes with production or activity level.
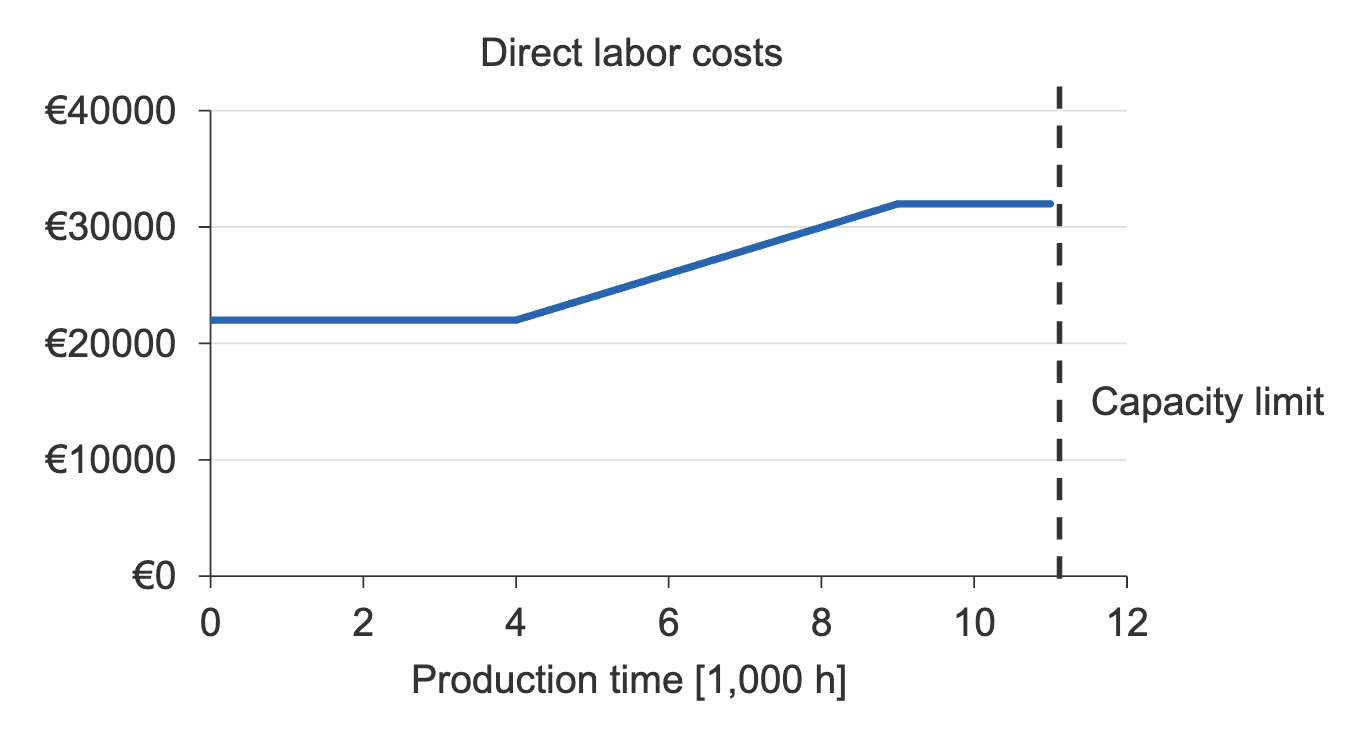
- Costs with Upper/Lower Limit are bounded by a maximum or minimum cost, which can occur due to constraints in resources or production capacity.
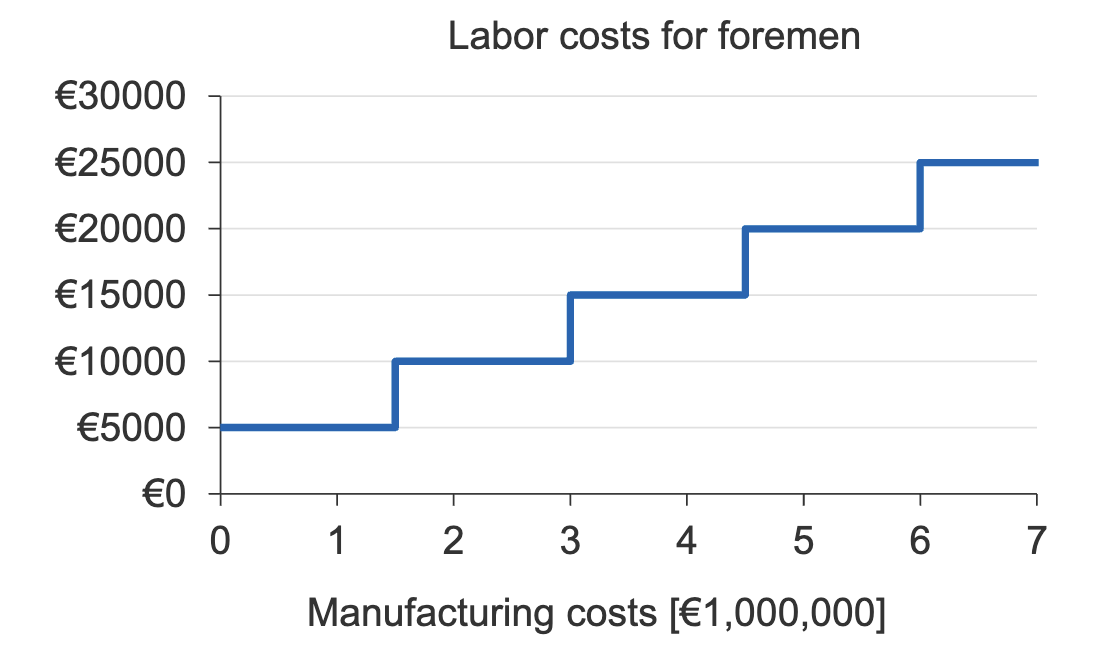
- Step Fixed Costs remain constant within certain ranges of production or activity but jump to a higher level once a threshold is exceeded, often due to the need for additional resources or capacity.
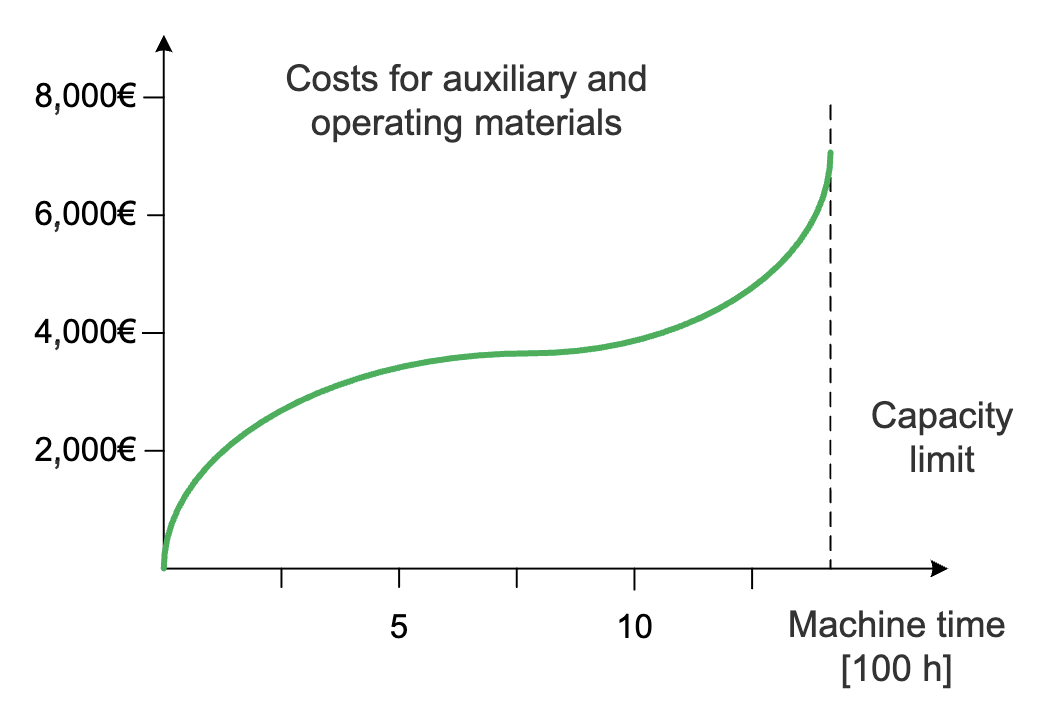
- S-Shaped Costs exhibit a combination of convex and concave behavior, where costs initially increase at an increasing rate, then at a decreasing rate as production or activity increases, often due to factors like learning curves at first and maintenance capacity limits later on.
Cost Drivers
Cost drivers may be input-oriented or output-oriented and be based on quantity or value.
Costs may be calculated based on a single or multiple cost drivers.
Examples include:
| Cost drivers | Input-oriented | Output-oriented |
|---|---|---|
| Quantity |
|
|
| Value |
|
|
Cost Driver Context
- Time Horizon: It’s relevant to consider the time horizon, as costs may be fixed in the short term but vary with one or more cost drivers in the long term.
- Learning Curves: Often, average manual work time decreases with the number of products produced, therefore the salary cost function is concave.
- Experience Curves: Same concept as learning curves, but additionally applies to automated activities.
Simplifying Cost Functions
Cost functions can become very complex, so simplifying them is often necessary for practical use. This can be done by:
- Aggregation: Combining multiple cost components into a single function, such as summing fixed and variable costs into a total cost function.
- Linearization: Approximating non-linear cost functions with linear functions.
- Homogenization: Assuming that all cost drivers have the same effect on costs.
Analytical Methods
Analytical methods to determine (simplify) a cost function analyze the cause-effect relationships of outputs and inputs (in terms of quantity and time), incorporating factors like the bill of material, work schedules, time-and-motion studies, empirical values, technical documentation, legal and contractual requirements.
Statistical Methods
Statistical methods use the costs of past periods to estimate cost functions. There are three common methods:
Account Analysis Method
Classifies costs as fixed, variable, or mixed based on the analyst’s judgment and experience. For each cost center from the past period, the analyst determines which share of the cost is fixed or variable. Summed up, this gives the fixed and variable cost functions.
High-Low Method
Uses the highest and lowest activity levels from the past period to objectively estimate variable and fixed costs, though this approach is sensitive to outliers which could lead to a distorted picture.
The variable cost per unit is calculated as the change in cost divided by the change in activity level between the high and low points, while the fixed cost is determined by subtracting the total variable cost at one of the levels from the total cost at the same.
The cost function is then a simple linear function:
with the fixed cost being .
Regression Analysis
Univariate or multivariate linear regression can be used to estimate cost functions based on historical cost data and multiple cost drivers. This method allows for a more accurate estimation of cost functions by considering the influence of multiple factors simultaneously, but it requires a larger dataset and more complex analysis compared to the other methods. For example, the dependent variable could be repair cost, with repair hours and orders being the independent variable.
Documentation
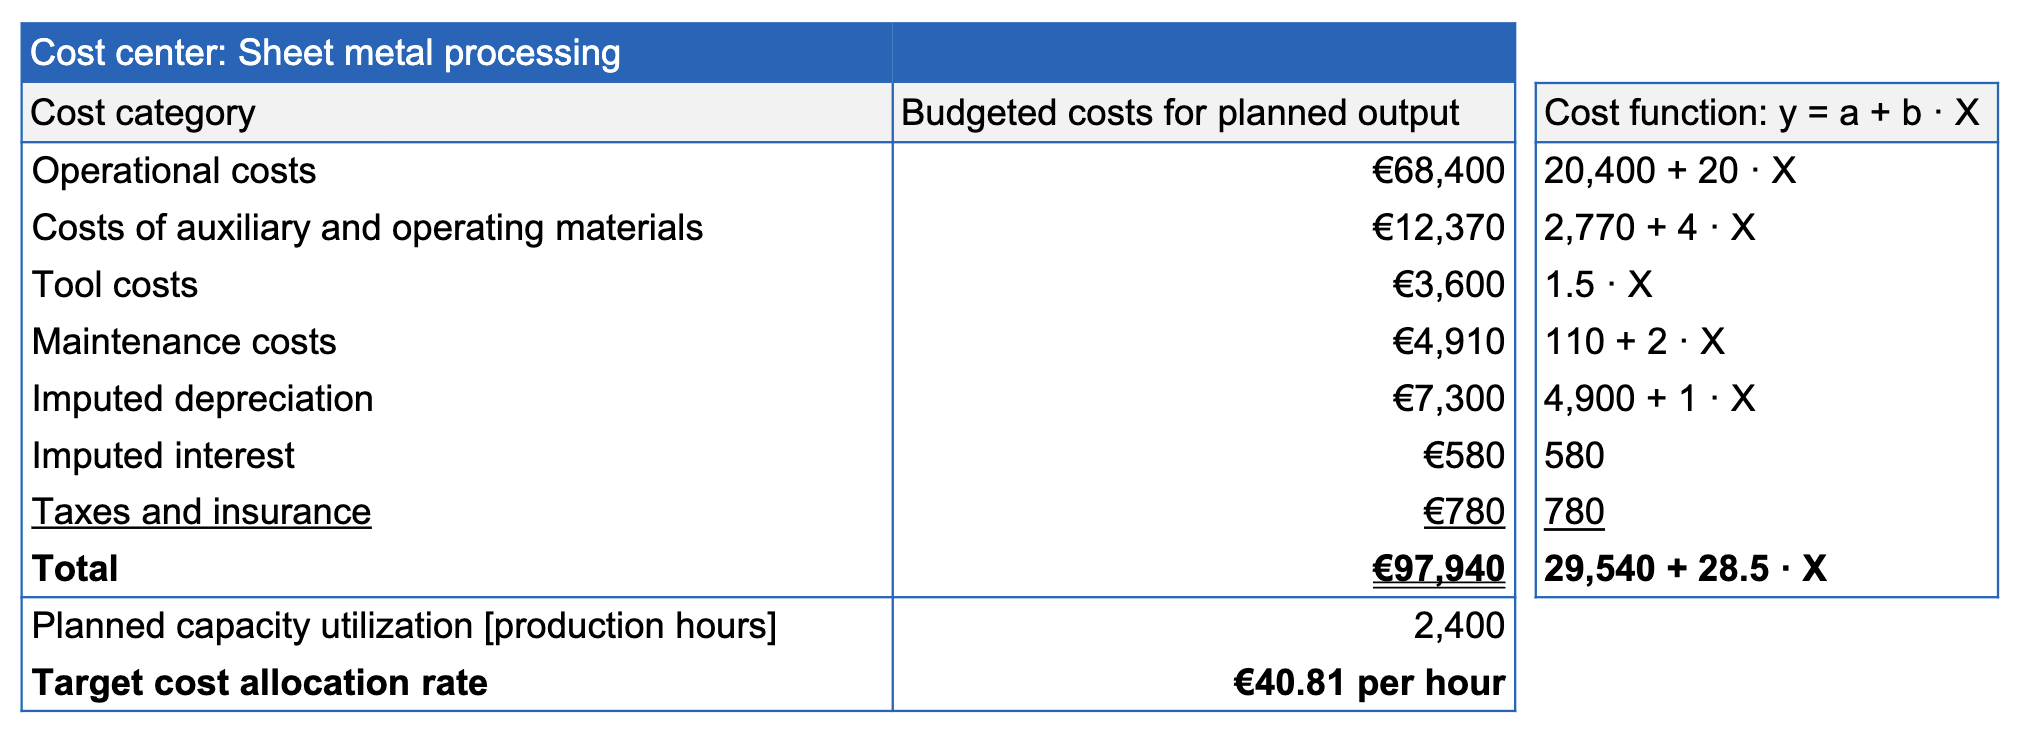
Cost functions can be complex to derive and should be documented. For this, cost-center summary sheets are used to document overhead cost forecasts for each cost center, assuming that each center is driven by only one cost center.
This is further divided into overhead cost categories (operations, material/tools, maintenance, depreciation, interest, taxes/insurance) with their cost functions documented, as well as the overall cost function for the cost center.
- Differentiated Reporting: In addition to the budgeted cost of the standard cost-center summary sheet, differentiated reporting adds columns for fixed and variable costs given the planned utilization.
- Step-by-Step Plans: These plans provide additional insight by forecasting costs for different levels of utilization (more or less than expected), which helps understanding how to behave in changing environments.